Download presentation
Presentation is loading. Please wait.

1
How does the Eastern Mediterranean photosynthetic community work CYCLOPS Addition experiment and resulting model

2
Why is the Eastern Med special? It is Ultra-Oligotrophic The annual productivity in the Sargasso Sea is 120- 130 gC m -2 y -1 The annual productivity in the E. Med is 60 gC m -2 y -1

3
The normal situation in the ocean: The Redfield Ratio 106CO 2 + 16NO 3 - +1HPO 4 2- C 106 H 263 O 110 N 16 P 1 +138O 2 PhotosynthesisRespiration N:P = 16:1

4
Progressively higher N:P ratio in deep water towards the E. Mediterranean 16:1 23:1 28:1

5
How do we know that the E. Med is P-limited in winter? In winter, when nutrients are mixed into surface waters, there is a phytoplankton bloom Bloom stops when system runs out of phosphate, but there is still nitrate present

6
Aim of the CYCLOPS programme To understand how the microbial food chain operates in the eastern Mediterranean To determine whether the Eastern Mediterranean is P-limited and what exactly that means To find out why the Eastern Mediterranean is P-limited

7
New data on Eastern Mediterranean The system is entirely P starved We knew that nitrate/phosphate in LDW (28:1) We found that PON:POP (30:1) And DON:DOP (~50:1) But both nitrate and phosphate are depleted in the photic zone
 We found that PON:POP (30:1) And DON:DOP (~50:1) But both nitrate and phosphate are depleted in the photic zone")
8
Nutrient Limitation elsewhere in the oceans Most of the ocean is N & P co-limited Some areas have high nutrients & low chlorophyll (HNLC) Iron limitation?
 Iron limitation")
9
How these areas were shown to be Fe limited Dissolved iron was measured and found to be unusually low Bottle experiments showed an increase in chlorophyll when Fe was added. Still not enough Designed and carried out an in-situ addition experiment

10
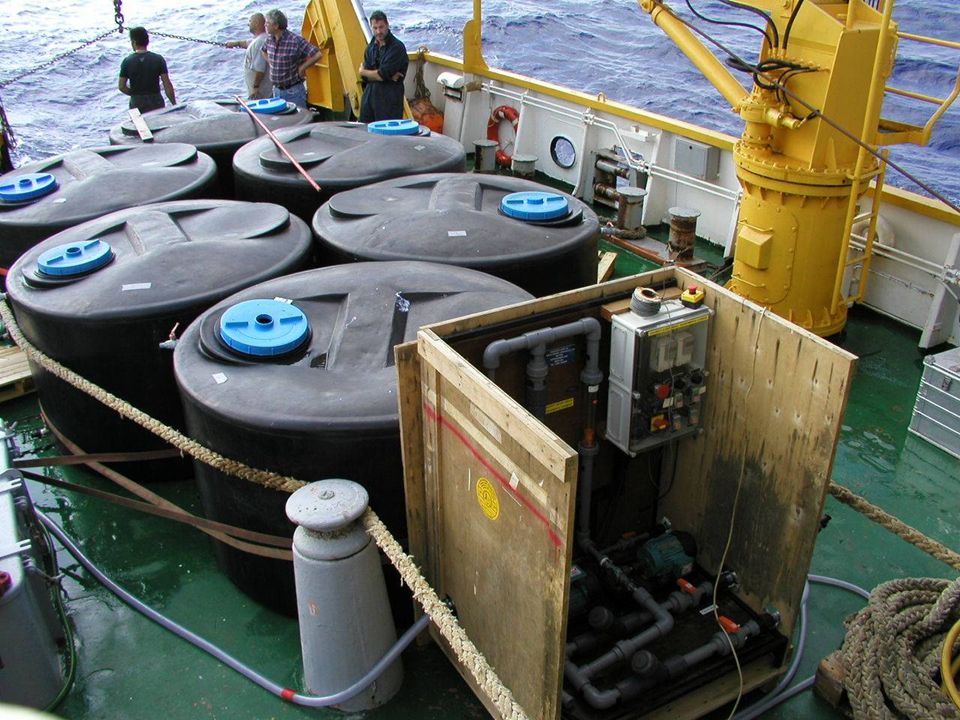
SOIREE iron addition experiment Add Fe and an inert tracer (SF6) to a patch of water Follow the chemical and biological effects
 to a patch of water Follow the chemical and biological effects")
11
Fe addition in the Southern Ocean (SOIREE, February 1999)
")
12
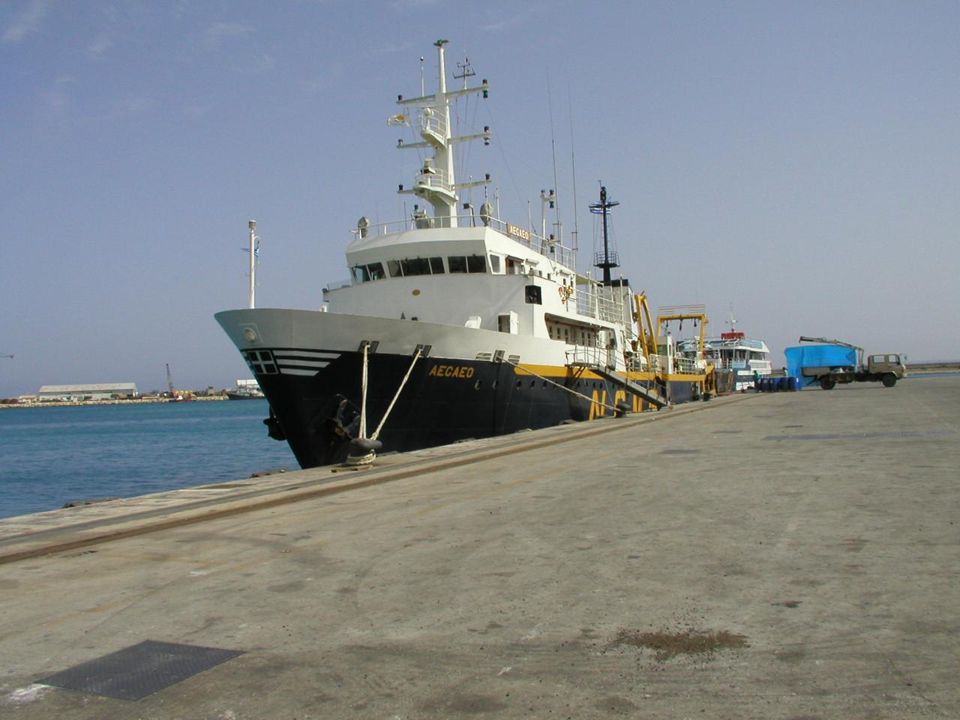
CYCLOPS Addition experiment May 2002 CYCLOPS addition experiment May 2002

17
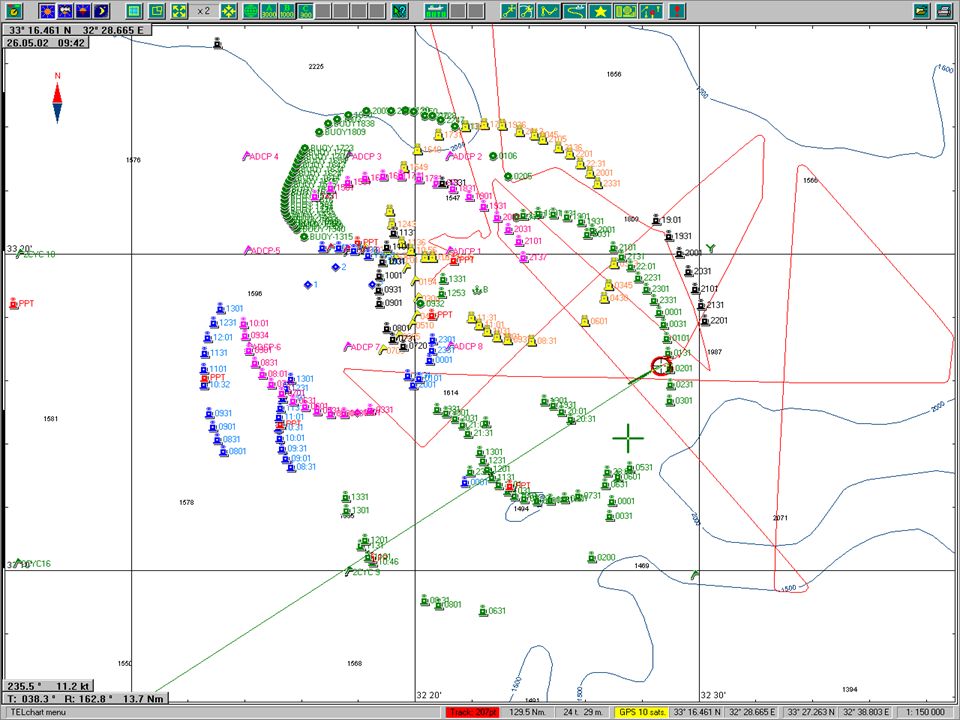
Day 0.6Day 2.0Day 3.9 Day 5.7Day 8.0 CYCLOPS P addition experiment: fertilized patch

19
Particulate-P average <20m SE

20
Biological uptake of P

21
Increase in bacterial growth after P addition

23
Total ciliates, mean (cells / l) before OUT d1 ?
 before OUT d1")
24
Gut Fullness of the zooplankton in the patch

25
Abundance of copepod eggs in the patch after P addition

26
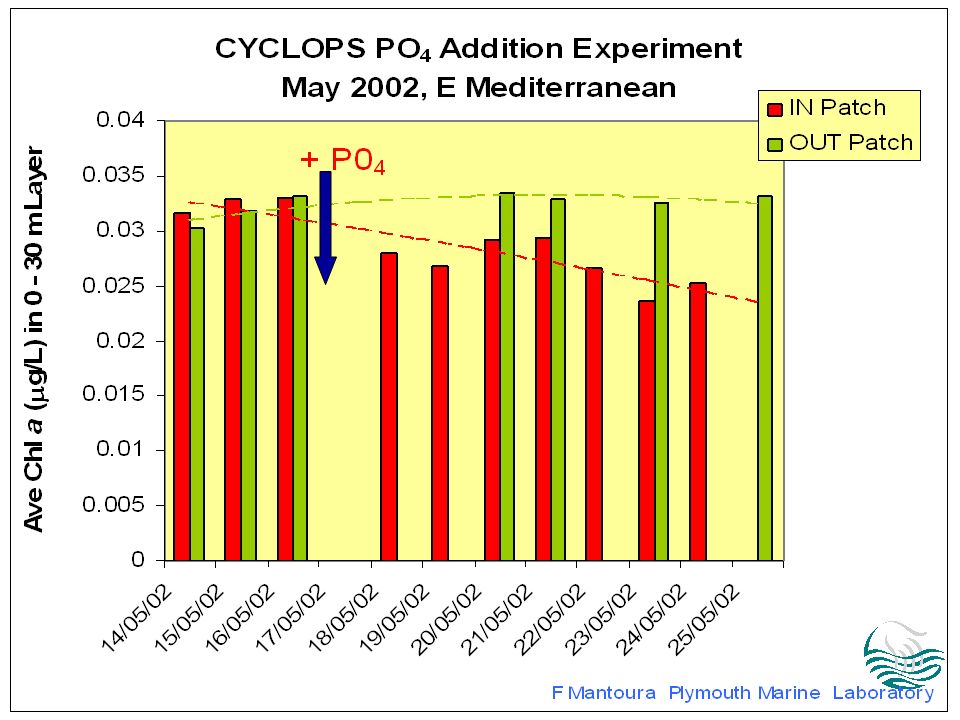
Conclusion When the ‘limiting’ nutrient is added to the E. Med the first rapid response is –an increase in bacterial activity –a reduction in the phytoplankton –an increase in micrograzers and in macrograzer egg production

28
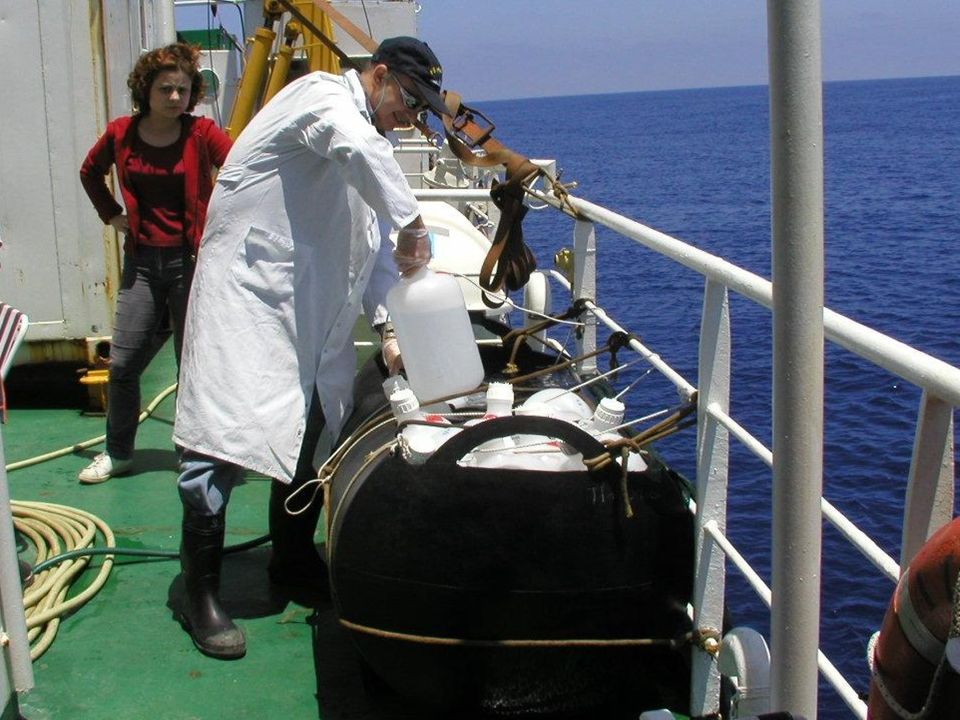
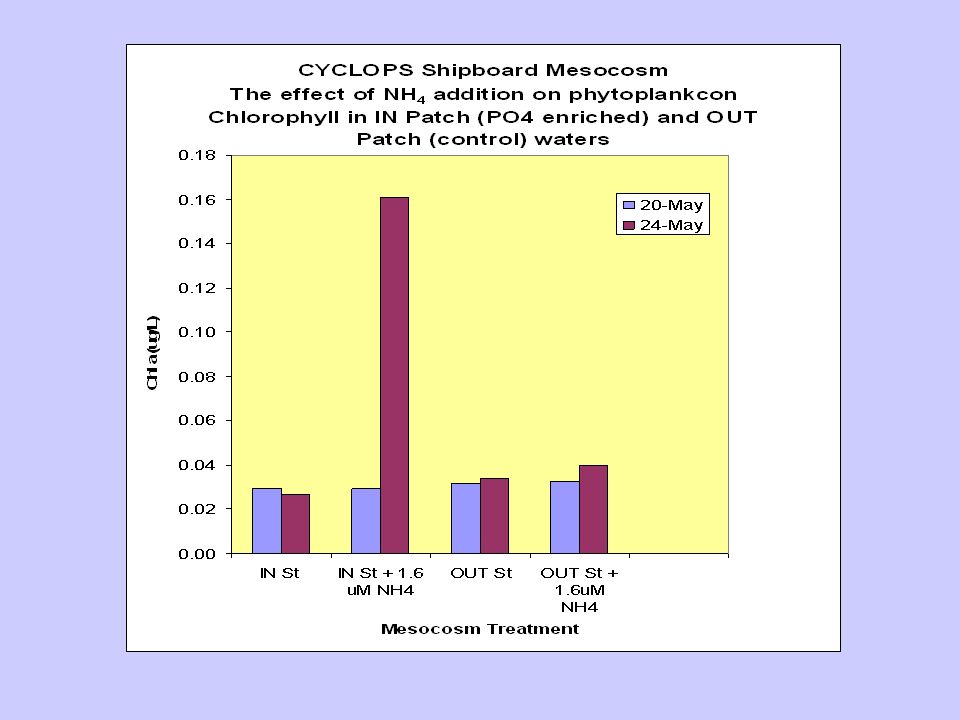
Microcosm experiment on-board 4 treatments x 3 replicates Patch water only Patch water with ammonia Out of patch water only Out of patch water with ammonia

30
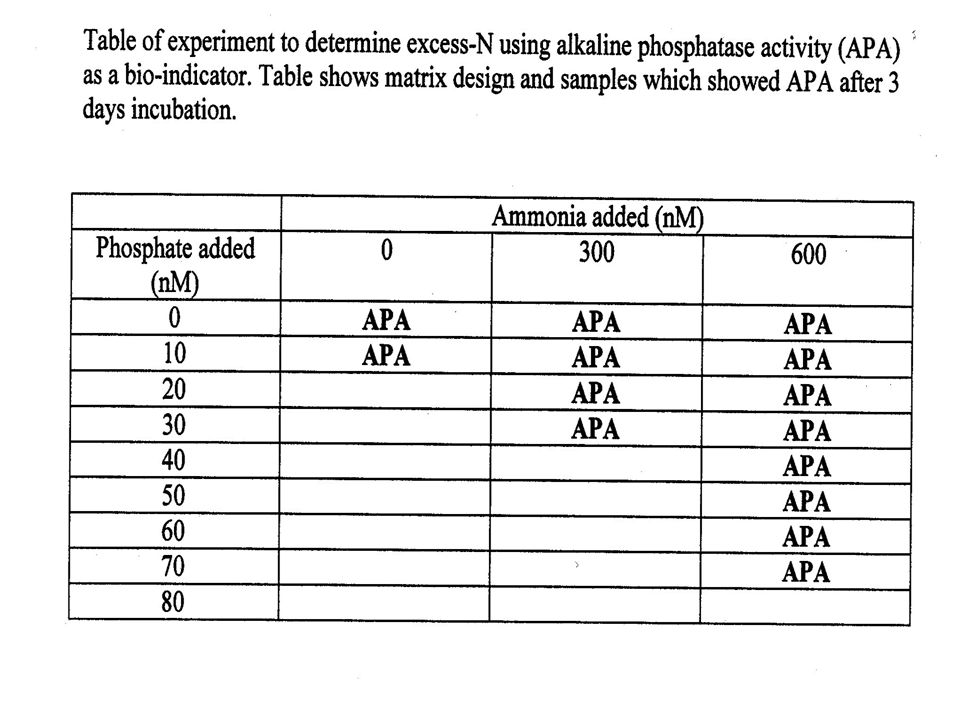
Nature of the nutrient limitation of the Phytoplankton How much N is available before the entire microbial system becomes N & P co-limited? Alkaline Phosphatase Bioassay

32
Slope of this curve is 17:1 Intercept is 230nM-N bioavailable-N

33
Heterotrophic Bacteria B L- DOC Heterotrophic Flagellates, H Pico and Nano- phytoplankton Ciliates C BCD Diatoms D Meso- zooplankton, M phosphate & ammonium/nitrate Silicate Offshore microbesCoastal microbes Schematic of the microbial ecosystem in the Eastern Mediterranean

34
Why is Productivity in the Eastern Mediterranean Phosphorus-Limited?

35
Is the high N:P ratio due to excess supply of N relative to P? New Hypothesis: The N/P ratio of nutrients supplied to the E. Mediterranean is >> 16:1.

36
Calculated nutrient inputs to the Eastern Mediterranean basin All values given in 10 9 moles/y

37
Calculate Steady-State Flux of nutrients through the Straits of Sicily

38
Calculated nutrient outputs from the Eastern Mediterranean basin All values given in 10 9 moles/y

39
But this is not the complete story! The GLOBAL Supply of N:P is >> 16:1 The N:P ratio of nutrients supplied to the world’s oceans is > 50:1 (Smith, 1984) Yet most of the world’s oceans have a N:P ratio of ~16:1 Why?
 Yet most of the world’s oceans have a N:P ratio of ~16:1 Why .")
40
Biological feedback mechanisms control N:P ratio in the oceans If there is excess P –N fixing phytoplankton flourish and produce fixed N in the water column If there is excess N –Nitrate reduction in coastal sediments or oxygen minimum zones which remove N (Seitzinger and Giblin 1996)
")
41
Why don’t global feedback mechanisms work in the E. Med? It is ultra-oligotrophic due to its unique anti-estuarine circulation Little excess organic matter and no pelagic oxygen minimum - almost no areas in which nitrate reduction occurs in the sediment.

42
Test of this hypothesis Are there any areas of the E.Med where the deep water N:P ratio is 16:1? Yes - the Northern Adriatic where nitrate reduction DOES occur

43
Why is the Eastern Mediterranean P limited? There is more N supplied to the basin than P The normal biological feedback mechanism does not work because the system is ultra-oligotrophic There is no evidence of N fixation

44
Summary P-limitation is not as simple as Fe-limitation; it is both time and organism dependant. Bacteria are P-limited throughout the year because they can access DON Phytoplankton recycle excess N to a form that is not bioavailable and become N & P co- limited in summer Grazers are P-starved and respond very rapidly to an external source of P

45
Summary: Why is the system is P-starved? N:P input >>16:1 Normal global buffer mechanism does not work in the E Med –the system is ultra-oligotrophic –no excess organic matter to fuel nitrate reduction

46
Any Questions?

Similar presentations


 and phosphate availability in the south Pacific ocean T. MOUTIN, P. RIMMELIN Laboratoire d Océanographie et de Biogéochimie.>")


 There is lots of variation in the 15 N values in the world’s oceans.>")


 –Photosynthesis –Chemosynthesis CO.>")

