Download presentation
Presentation is loading. Please wait.

1
EPID 623-88 Introduction to Analysis and Interpretation of HIV/STD Data Introduction: STDs and HIV—a brief background Manya Magnus, Ph.D. Summer 2001

2
Objectives To briefly describe magnitude of STD and HIV problem in the United States To discuss relationship between classical STDs and HIV

3
Magnitude of the problem Annual global incidence of curable STDs is 333 million cases The top four most common are gonorrhea (62 million), chlamydia (89 million), syphilis (12 million) and trichomonas (170 million) An estimated 250 million new infections occur each year 15 million new cases diagnosed annually in the United states 3 million of these cases in US are teenagers Annual cost of major STDs in US: almost $17 million
, chlamydia (89 million), syphilis (12 million) and trichomonas (170 million) An estimated 250 million new infections occur each year 15 million new cases diagnosed annually in the United states 3 million of these cases in US are teenagers Annual cost of major STDs in US: almost $17 million")
5
TWENTY-FIVE SEXUALLY TRANSMITTED PATHOGENS AND ASSOCIATED DISEASES OR SYNDROMES - BACTERIA

7
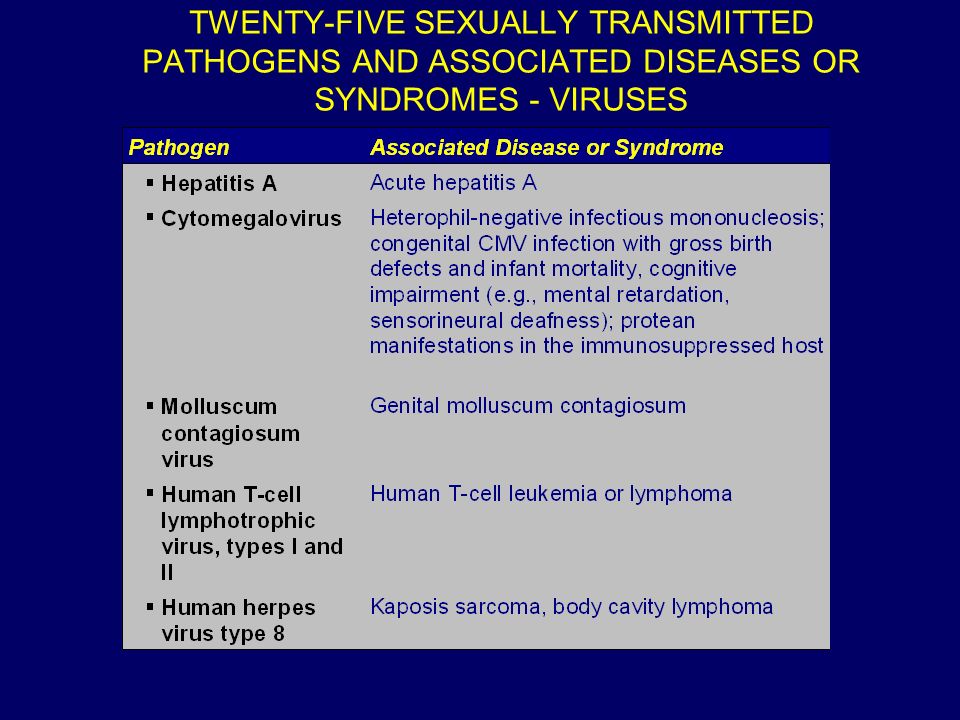
TWENTY-FIVE SEXUALLY TRANSMITTED PATHOGENS AND ASSOCIATED DISEASES OR SYNDROMES - VIRUSES

9
TWENTY-FIVE SEXUALLY TRANSMITTED PATHOGENS AND ASSOCIATED DISEASES OR SYNDROMES - OTHER

10
Gonorrhea — Reported rates: United States, 1970–1999 and the Healthy People year 2000 objective

11
Gonorrhea — Rates by region: United States, 1981–1999 and the Healthy People year 2000 objective

12
Gonorrhea — Rates by state: United States and outlying areas, 1999 Note: The total rate of gonorrhea for the United States and outlying areas (including Guam, Puerto Rico and Virgin Islands) was 131.4 per 100,000 population. The Healthy People year 2000 objective is 100 per 100,000 population.

13
Gonorrhea — Rates by race and ethnicity: United States, 1981–1999 and the Healthy People year 2000 objective Note: "Other" includes Asian/Pacific Islander and American Indian/Alaska Native populations. Black, White, and Other are non-Hispanic.

14
Syphilis — Reported cases by stage of illness: United States, 1941–1999

15
Primary and secondary syphilis — Reported rates: United States, 1970–1999 and the Healthy People year 2000 objective

16
Primary and secondary syphilis — Rates by state: United States and outlying areas, 1999 Note: The total rate of primary and secondary syphilis for the United States and outlying areas (including Guam, Puerto Rico and Virgin Islands) was 2.5 per 100,000 population. The Healthy People year 2000 objective is 4.0 per 100,000 population.

17
Primary and secondary syphilis — Rates by region: United States, 1981–1999 and the Healthy People year 2000 objective

18
Chlamydia — Reported rates: United States, 1984–1999

19
Chlamydia — Rates by state: United States and outlying areas, 1999 Note: *The New York City rate was 360.7 per 100,000 population. No cases were reported outside of New York City. The total rate of chlamydia for the United States and outlying areas (including Guam, Puerto Rico and Virgin Islands) was 250.9 per 100,000 population.
 was per 100,000 population..")
20
Chlamydia — Rates by region: United States, 1984–1999

21
Chlamydia — Rates by gender: United States, 1984–1999

22
Chlamydia — Positivity among 15-24 year old women tested in family planning clinics by state, 1999 Note: States reported chlamydia positivity data on at least 500 women aged 15-24 years screened during 1999 except for Rhode Island; for Puerto Rico, ‑ chlamydia positivity data were reported for August-December only. SOURCE: Regional Infertility Prevention Prog rams; Office of Population Affairs; Local and State STD Control Programs; Centers for Disease Control and Prevention

23
Chlamydia — Age- and gender- specific rates: United States, 1999

24
Chlamydia — Rates by region: United States, 1984–1999

25
HIV/AIDS Relationship between classical STDs and HIV Increases in HIV transmission in presence of STDs. –Increased genital track shedding of virus (transmission) –Increased attraction of CD4+ lymphocytes to mucosa (transmission) –Micro-abrasions of genital tissue increased portals of entry/exit (transmission/acquisition) –Increased attraction of CD4+ lymphocytes to mucosa (acquisition)
 –Increased attraction of CD4+ lymphocytes to mucosa (transmission) –Micro-abrasions of genital tissue increased portals of entry/exit (transmission/acquisition) –Increased attraction of CD4+ lymphocytes to mucosa (acquisition).")
26
Estimated Number of Persons Living with AIDS, 1993 -1998, by Sex, United States Year Thousands 199319941995 1996 19971998 250 200 150 100 50 0 Men Women

27
American Indian/ Alaska Native Black, not Hispanic Hispanic Asian/Pacific Islander White, not Hispanic 199319941995199619971998 Year 0 20 40 60 80 100 120 140 Estimated Number of Persons Living with AIDS, 1993 - 1998, by Race/Ethnicity, United States Thousands

28
2020 4040 6060 12 0 10 0 8080 0 U.S. dependencies and possessions North Central Northeast South 199519961997199819941993 Year Estimated Number of Persons Living with AIDS, 1993 -1998, by Region, United States West Thousands

29
0 Year of Report Proportion of AIDS Cases, by Race/Ethnicity and Year of Report,1985-1999, United States Percent of Cases 19851987198919911993199519971999 10 20 30 40 50 60 70 American Indian/ Alaska Native Black, not Hispanic Hispanic Asian/Pacific Islander White, not Hispanic

30
0 10 20 30 40 50 60 70 80 198519871989199119931995 June 1999 Year of Diagnosis Adult/Adolescent AIDS Cases by Exposure Category and Year of Diagnosis, 1985 - June 1999 United States Other includes cases with other or unreported risk exposure. Data adjusted for reporting delays and risk redistribution. 1997 MSM & IDU Men who have sex with men (MSM) Injection drug use (IDU) Other Heterosexual contact Percent of Cases
 Injection drug use (IDU) Other Heterosexual contact Percent of Cases.")
31
AIDS Cases and Deaths Reported through 1999, United States Deaths Cases Adult/Adolescent 724,656425,357 Children 8,7185,084 Total 733,374 430,441

32
<5 5 - 14.9 15+ AIDS Rates per100,000 Population Reported in1999 Rate per 100,000 8.4 VI 32.6 PR 32.1 DE MA RI CT NJ MD DC NH VT 3.4 3.8 25.1 24.7 17.9 23.5 10.8 29.5 161.5 36.2 15.2 42.3 16.4 24.7 21.5 19.5 15.9 18.4 2.4 16.4 3.8 4.9 2.9 3.0 4.0 4.4 4.0 2.2 1.1 3.1 1.5 2.0 6.3 6.8 13.4 7.3 5.3 7.9 6.4 7.6 9.7 12.8 6.6 6.1 7.0 13.8 10.9 10.4 13.7 6.4

Similar presentations


 287-5193>")


 and two non->")


 data as of 05/16/2012 Epidemiology of.>")

>")