Download presentation
Presentation is loading. Please wait.

1
Cambrian School District 2010-11 Academic Performance Index (API) Adequate Yearly Progress (AYP) Program Improvement (PI) Report
 Adequate Yearly Progress (AYP) Program Improvement (PI) Report")
2
Overview Academic Performance Index (API) Stickers, Sliders, Gainers Adequate Yearly Progress (AYP) Program Improvement (PI) Next Steps
 Stickers, Sliders, Gainers Adequate Yearly Progress (AYP) Program Improvement (PI) Next Steps")
3
Academic Performance Index API California Model Improvement Model Weighted score By subject matter Advancement from lower levels earns higher points High Performing equals score above 800

4
District Academic Performance Index District API20072008200920102011 Change 2010-11 Change 2007-11 All Students853860867878874- 4+ 21 Asian942949936960957- 3+ 15 Hispanic751761782791775- 16+ 24 White882888892902900- 2+ 18 Economically Disadvantaged738743770760754- 6+ 16 English Learner737742774790785- 5+ 47 Students with Disabilities612638591650673+ 23+ 61

5
Bagby Academic Performance Index Bagby API20072008200920102011 Change 2010-11 Change 2007-11 All Students892897906924905- 19+ 13 Hispanic789793833848827- 21+ 38 White916918922940920- 20+ 4 Economically Disadvantaged776765830816793- 23+ 17

6
Fammatre Academic Performance Index Fammatre API20072008200920102011 Change 2010-11 Change 2007-11 All Students888895913910888- 220 Asian--- 985977947- 30 09-11 - 38 Hispanic832860847850819- 31- 13 White900899926918905- 13+ 5 Economically Disadvantaged803---810802743- 59- 60 English Learners882831- 51n/a

7
Farnham Academic Performance Index Farnham API20072008200920102011 Change 2010-11 Change 2007-11 All Students845847864847849+ 2+ 4 Hispanic696689800755734- 21+ 38 White852840898890 0+ 38 Economically Disadvantaged705666777706729+ 23+ 24 English Learner833776758- 18 09-11 - 75

8
Sartorette Academic Performance Index Sartorette API20072008200920102011 Change 2010-11 Change 2007-11 All Students898894890898877- 21 Asian971969- 2n/a Hispanic823808781830773- 57- 50 White914912920 915- 5+ 1 Economically Disadvantaged826804784796739- 57- 87 English Learner775820793- 27 09-11 + 18

9
Price Academic Performance Index Price API20072008200920102011 Change 2010-11 Change 2007-11 All Students819845838864 0+ 46 Asian928914913949955+ 6+ 27 Hispanic723732743763759- 5+ 36 White864866864892893+ 1+ 29 Economically Disadvantaged 700 734735752756+ 4+ 56 English Learner708724763+ 39 09-11 + 54

10
Stickers, Sliders, Gainers Five Performance Levels Far Below Basic (FBB), Below Basic (BB), Basic (B), Proficient (P) Advanced (A) Stickers Students remaining in the same Performance Level, 2010-2011 Sliders Students losing one or more Performance Levels, 2010-2011 Gainers Students gaining one or more Performance Levels, 2010-2011
, Below Basic (BB), Basic (B), Proficient (P) Advanced (A) Stickers Students remaining in the same Performance Level, Sliders Students losing one or more Performance Levels, Gainers Students gaining one or more Performance Levels,")
11
2 nd Grade English Language Arts FBB= 14 BB = 27 B = 64 PR= 111 AD= 169 Math FBB = 10 BB = 33 B = 36 PR= 119 AD = 186

12
3 rd Grade FBB=11 BB=36 B=70 PR=106 AD=120FBB=3 BB=29 B=44 PR=63 AD=201

13
4th Grade FBB=5 BB=22 B=48 PR=55 AD=188FBB=6 BB=18 B=44 PR=69 AD=178

14
5th Grade FBB=9 BB=9 B=67 PR=86 AD=171FBB=3 BB=34 B=61 PR=97 AD=147

15
6th Grade FBB=5 BB=13 B=55 PR=80 AD=162FBB=8 BB=28 B=55 PR=105 AD=119

16
7th Grade FBB=7 BB=14 B=44 PR=96 AD=151FBB=12 BB=36 B=71 PR=110 AD=82

17
8th Grade FBB=11 BB=24 B=55 PR=89 AD=155FBB=25 BB=93 B=64 PR=69 AD=83

18
Adequate Yearly Progress AYP Federal Model--No Child Left Behind Performance Model Measures Percent Proficient Numerically significant student subgroups Targets increase each year until 2014 2010 targets ELA 56.8 Math 47.5 2011 targets ELA 67.6% Math 68.5% 2012 targets ELA 78.4% Math 79%

19
District ELA Met AYP Criteria Asian White Did not meet AYP Criteria Hispanic English Learners Economically Disadvantaged Students with Disabilities

21
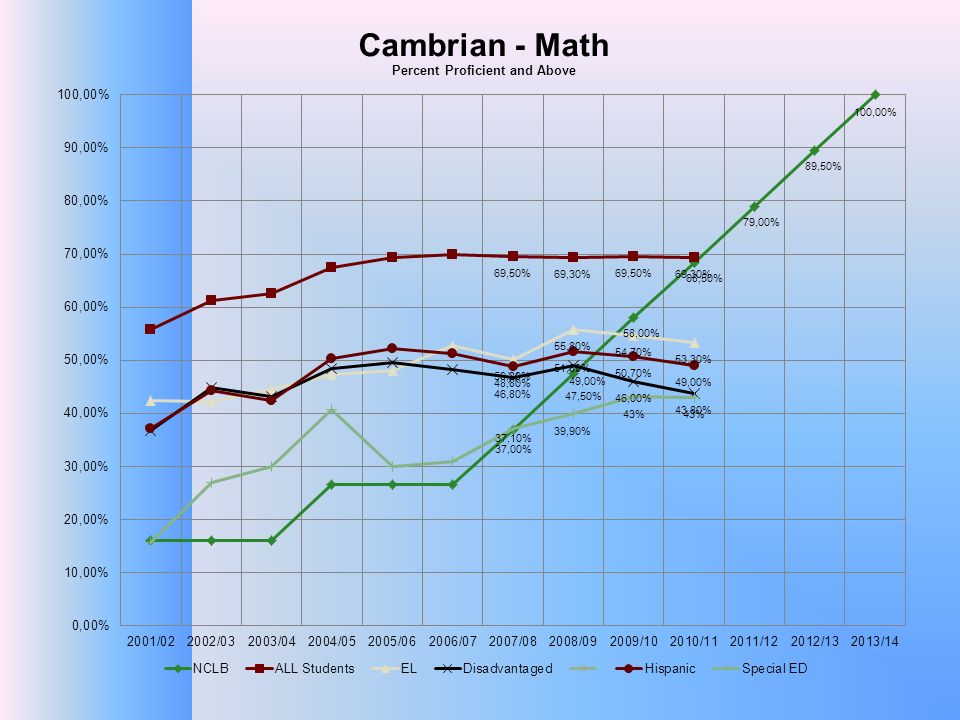
District Math Met Criteria Asian White Did not meet Criteria Hispanic English Learners Economically Disadvantaged Students with Disabilities

23
Bagby ELA Met AYP Criteria White Did not meet AYP Criteria Hispanic Economically Disadvantaged

25
Bagby Math Met Criteria White Did not meet Criteria Hispanic Economically Disadvantaged

27
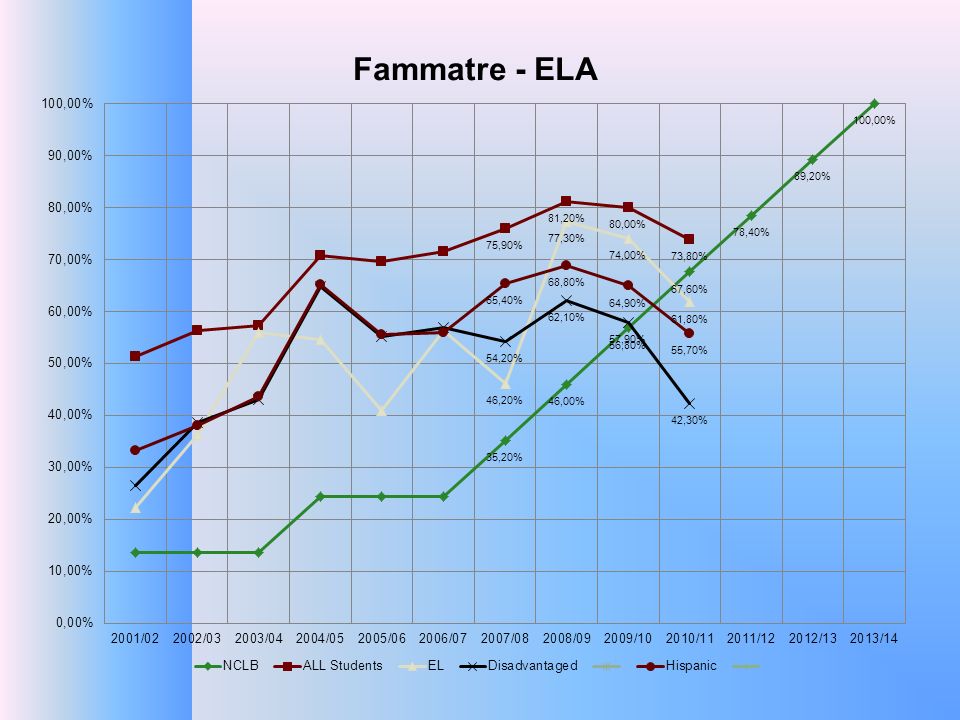
Fammatre ELA Met AYP Criteria Asian White English Learner with Year 2 Did not meet AYP Criteria Hispanic Economically Disadvantaged

29
Fammatre Math Met Criteria Asian White Hispanic with Year 2 English Learners Did not meet Criteria Economically Disadvantaged

31
Farnham ELA Met AYP Criteria White Did not meet AYP Criteria Hispanic English Learners Economically Disadvantaged

33
Farnham Math Met Criteria White Economically Disadvantaged with Year 2 Did not meet Criteria Hispanic English Learners

35
Sartorette ELA Met AYP Criteria Asian White Did not meet AYP Criteria Hispanic English Learners Economically Disadvantaged

37
Sartorette Math Met Criteria Asian White Did not meet Criteria Hispanic English Learners Economically Disadvantaged

39
Price ELA Met AYP Criteria Asian White English Learners with Safe Harbor Economically Disadvantaged with Safe Harbor Did not meet AYP Criteria Hispanic

41
Price Math Met Criteria Asian English Learners with Safe Harbor Did not meet Criteria White Hispanic Economically Disadvantaged

43
Program Improvement Program Improvement (PI) is a formal designation for Title l funded schools and local education agencies (LEAs) that do not make AYP for two consecutive years school wide or for any numerically significant subgroups, according to the No Child Left Behind Act (NCLB).
 is a formal designation for Title l funded schools and local education agencies (LEAs) that do not make AYP for two consecutive years school wide or for any numerically significant subgroups, according to the No Child Left Behind Act (NCLB).")
44
Program Improvement This year, the district, as well as Farnham and Sartorette, are in Year 1 PI due to the scores in some of the subgroups.

45
Program Improvement Under NCLB, PI schools and LEAs are responsible for implementing specific federal and state requirements during each year they are in PI.

46
Program Improvement Year 1 Requirements Schools –Within three months, revise SPSA based on results of data and needs assessment to incorporate required school improvement components; covers two year period –Implement SPSA –Establish system to continuously monitor school progress

47
Program Improvement Year 1 Requirements District (LEA) –Provide assistance to PI schools to develop and implement revised SPSA –Provide timely and varied school and student data to sites –Notify parents of PI status –Secure Board approval of revised SPSAs –Complete needs assessment –Review and revise LEA plan and secure Board approval
 –Provide assistance to PI schools to develop and implement revised SPSA –Provide timely and varied school and student data to sites –Notify parents of PI status –Secure Board approval of revised SPSAs –Complete needs assessment –Review and revise LEA plan and secure Board approval")
48
Next Steps Completion of all requirements for Year I PI Data disaggregation –Site, grade level, subgroups, students Revision of all SPSAs Analysis of benchmark and assessment data Increased accountability Ongoing specific tracking of students throughout year and adjusting instruction –Student by student Targeted interventions and extensions

Similar presentations


 and Annual Yearly Progress (AYP) October 15, 2012.>")
 & CAHSEE 2009-10 Results Update Prepared for the September 21, 2010 Board of Education.>")


 Academic Performance Index (API) and Assessing California Standards Test (CST) Data.>")


 Academic Performance Index (API) SAIT Training September 27, 2007.>")
 Cambrian School District June 5, 2014.>")