Download presentation
Presentation is loading. Please wait.

1
Basic Satellite Communication (2) Frequency Allocation, Spectrum and Key Terms
Dr. Joseph N. Pelton

2
Satellite Frequencies & Spectrum
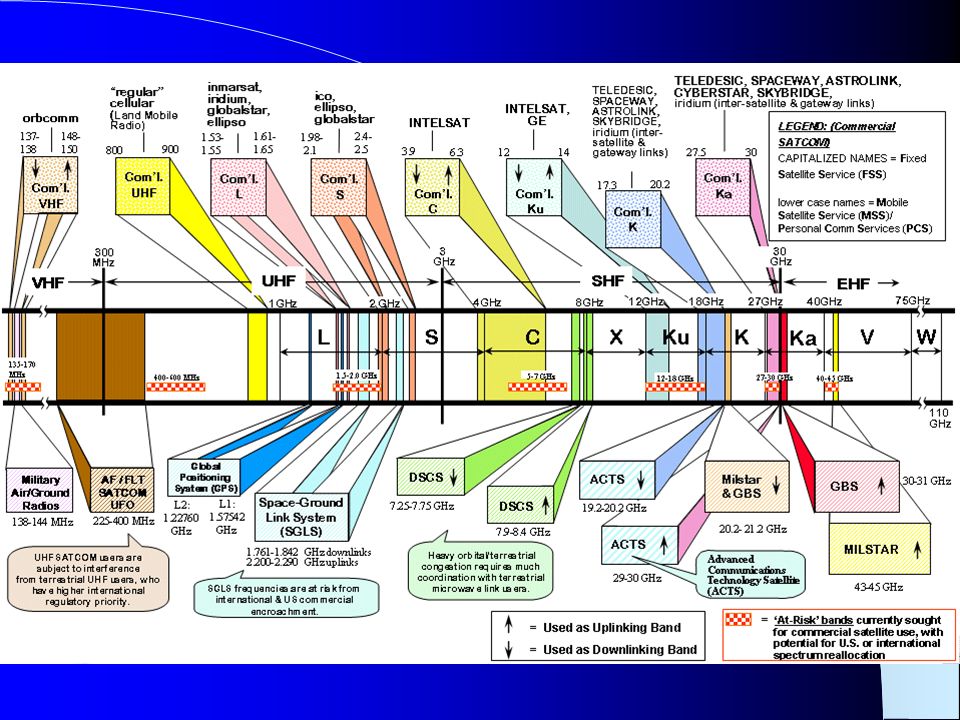
Radio Frequencies are simply a part of the electromagnetic spectrum. This extends from Extremely Low to Extremely High Frequencies to Infra-red to Visible Light (Photons) to Ultra-Violet to X-rays to Cosmic Radiation that represents the highest frequencies of all and at the highest energy. Spectrum is truly a vital resource for communications satellites. Formula C (or 3x 10⁸ m/sec) = Wavelength x Frequency The radio wave band that is used by satellites is divided into the following categories that have been named over time. mailto:
 to Ultra-Violet to X-rays to Cosmic Radiation that represents the highest frequencies of all and at the highest energy. Spectrum is truly a vital resource for communications satellites. Formula C (or 3x 10⁸ m/sec) = Wavelength x Frequency. The radio wave band that is used by satellites is divided into the following categories that have been named over time. mailto:")
4
Satellite Frequencies & Spectrum
Very High Frequency 30 MHz to 300 MHz : to 1 meters VHF Ultra High Frequency 300 MHz to 3000 MHz : to 10 meters UHF Super High Frequency 3 GHz to 30 GHz : 10cm to 1 cm SHF Extremely High Frequency 30 GHz to 300 GHz : 10mm to 1 mm EHF

5
Satellite Frequencies Fixed Satellite Services (FSS)*
Status Available Usable Band Up & Down Links Name of Band Virtually saturated band 500MHz 6GHz-Up 4GHz-Down C-Band Very heavily used band 500MHz+250MHz 14 GHz-Up 11/12 GHz-Down Ku-Band Just beginning to be used 3000 MHz 2500 MHz 27-30 GHz-Up 17-20 GHz-Down Ka-Band Largely experimental 2000 MHz 48-50 GHz-Up 38-40 GHz-Down Q/V Band * Note: Other allocations in X band 8/7 GHz for government services

6
Satellite Frequencies Mobile Satellite Services (MSS)*
Major MSS Assigned Bands* 1525~1559 MHz (L-Band) 1610~ MHz (L-Band) 1626.5~ MHz (L-Band) 1980~2025 MHz (L-Band) 2160~2200 MHz (S-Band) 2483~2500 MHz (S-Band) 30/20 GHz (Ka/Ku Band)** *Available spectrum in L-Band is allocated in units of MHz and thus very intensive reuse is needed to support global demands ** Feeder Links in the Fixed Satellite Services (FSS) Bands. Feeder link: A radio link between a gateway earth terminal and a satellite.
 1610~ MHz (L-Band) ~ MHz (L-Band) 1980~2025 MHz (L-Band) 2160~2200 MHz (S-Band) 2483~2500 MHz (S-Band) 30/20 GHz (Ka/Ku Band)** *Available spectrum in L-Band is allocated in units of MHz and thus very intensive reuse is needed to support global demands. ** Feeder Links in the Fixed Satellite Services (FSS) Bands. Feeder link: A radio link between a gateway earth terminal and a satellite.")
7
Satellite Frequencies Mobile Satellite Services (MSS)*
Satellite Messaging (Store & Forward)* 137~138 MHz (down) 148~149.9 MHz (up) 149.9~ MHz (up) 399.9~400.5 MHz (up) 400.15~401 MHz (down) and 432 MHz *Typical application is for store and forward messaging to support tracking of vehicles, trains, ships at sea, updates on pipeline flow or commands to SCADA (Supervisory Control and Data Acquisition) terminals at power plants etc. Many Security applications
* 137~138 MHz (down) 148~149.9 MHz (up) 149.9~ MHz (up) 399.9~400.5 MHz (up) ~401 MHz (down) and 432 MHz. *Typical application is for store and forward messaging to support tracking of vehicles, trains, ships at sea, updates on pipeline flow or commands to SCADA (Supervisory Control and Data Acquisition) terminals at power plants etc. Many Security applications.")
8
Satellite Frequencies
Broadcast Satellite Services 17.3~18.1 FSS-Uplink Feeders for BSS Downlinks 12.2~12.7 GHz (Reg. 2-Americas) 11.7~12.45 GHz (Reg. 1 & 3 Europe, Africa & Asia) (Plus other allocations at 700 MHz, at 2.6 GHz, 22GHz and 42 GHz bands. (2.6 GHz used for direct audio broadcasting) Space Navigation Satellite Services 1.6 GHz (i.e. GPS) ITU-Regions 1,2 and 3 visit
 11.7~12.45 GHz (Reg. 1 & 3 Europe, Africa & Asia) (Plus other allocations at 700 MHz, at 2.6 GHz, 22GHz and 42 GHz bands. (2.6 GHz used for direct audio broadcasting) Space Navigation Satellite Services. 1.6 GHz (i.e. GPS) ITU-Regions 1,2 and 3 visit")
9
Basic Terms and Concepts
The field of Satellite Communications is based on large number of basic terms, concepts and mathematics and physical theorems. Most of these can straightforward ideas. These include spectrum, RF, bandwidth, Hz, decibles, dBm, antenna gain, G/T, Quality of Service, S/N, system availability, flux density, transponders, filters, amplifiers, analog and digital modulation, multiplexing, intermediate Frequency and Base band, carrier, etc. G/T - A Receiving System Figure of Merit The sensitivity of a radio telescope is a function of many factors including antenna gain (G) and system noise temperature (T). We all understand the need for high gain antennas and low noise preamplifiers. But how do we measure just how well the system is performing? A convenient figure of merit is the ratio (G/T) - the higher this ratio the better the sensitivity of the system to weak signals. To obtain G/T one could determine G and T separately, but these are difficult measurements. Fortunately it is relatively easy to obtain the ratio (G/T) by a single measurement (and a little arithmetic).
 and system noise temperature (T). We all understand the need for high gain antennas and low noise preamplifiers. But how do we measure just how well the system is performing A convenient figure of merit is the ratio (G/T) - the higher this ratio the better the sensitivity of the system to weak signals. To obtain G/T one could determine G and T separately, but these are difficult measurements. Fortunately it is relatively easy to obtain the ratio (G/T) by a single measurement (and a little arithmetic).")
10
Basic Terms and Concepts
The purpose of this lecture is to become familiar with these terms, their meanings and how to use them. We will return to these in greater depth later. This is just a first introduction.

11
The Significance of Frequencies and Line of Sight
VHF signals involve long enough wavelengths that they are not easily blocked by trees, foliage, power lines, etc. But as one moves up to UHF and SHF the systems become increasingly line of sight systems. For FSS services it is possible to line an earth station up with a satellite and no barriers intervene and thus use SHF or EHF spectrum, but for Mobile Satellite Services (MSS), the frequencies must be low enough (and wavelengths long enough) to not be easily blocked. This means that high link margins are needed for MSS services, especially for cars.
, the frequencies must be low enough (and wavelengths long enough) to not be easily blocked. This means that high link margins are needed for MSS services, especially for cars.")
12
Electro-Magnetism Electromagnetism is one of the four basic forces in the universe. These are: (i) Gravity, (ii) Electromagnetism, (iii) the strong nuclear force and (iv) the weak nuclear force. The elecro-magnetic spectrum covers a very wide range of frequency for very low frequency cycles up to those that we can hear to ultra-sonic to radio waves to infrared, optical signals, ultra-violet, X-rays on up to the very high energy cosmic waves at the highest frequencies.
 Gravity, (ii) Electromagnetism, (iii) the strong nuclear force and (iv) the weak nuclear force. The elecro-magnetic spectrum covers a very wide range of frequency for very low frequency cycles up to those that we can hear to ultra-sonic to radio waves to infrared, optical signals, ultra-violet, X-rays on up to the very high energy cosmic waves at the highest frequencies.")
13
Radio Frequency (RF) Spectrum
The most often used radio wave bands that are used by satellites is divided into the following categories that have been named over time. HF = 3 MHz to 30 MHz or 100 to 10 meters VHF = 30 MHz to 300 MHz or 10 to 1 meters UHF = 300 MHz to 3000 MHz or 100cm to 10 cm SHF = 3 GHz to 30 GHz or 10cm to 1 cm EHF = 30 GHz to 300 GHz or 10mm to 1 mm

14
Hertz Hertz = Cycles per second. kHz or kiloHertz = 1000 Cycles per second. MHz or MegaHertz = 1,000,000 Cycles per second GHz or GigaHertz = 1 billion cycles per second. Speed of light or C = 3 x 10⁸ m/second C=Frequency x Wavelength Thus a frequency of 3 MHz or 3 million cycles/second is C (or the speed of light which is 3 x 10⁸ m/second divided by 100 meters = 3 x 10⁶ cycles/second. Thus 300 MHz represents a wavelength of 1 meter and 3GHz represents a wavelength of 10cm. What would be wavelength of 6GHz in cm?

15
Decibels A decibel is a logarithmic scale measure that is used in communications and particularly for satellite communications because it allows for a dramatic range of power variations. Due to the high orbit of Geo Satellites path loss represents effective power reduction by many, many orders of magnitude. A decibel range on the basis of a logarithmic scale of 10. A 3 dB gain means that a power level has doubled. 6 dB means a gain of 4, a 10 dB gain means a gain of 10, 20 dB means a gain of 100 and 30 dB means a gain of 1000 and 60 dB means a gain of 1 million times. It also works the same way in terms of decreases. A -3 dB shift means power is reduced by half. A -6 dB means power is reduced by 4, a -10 dB reduction is shown by 10. Thus -30 dB is a reduction of 1000 times. This is also a known as a dBm or a thousandth of a dB. What would a gain of 1,000,000 be expressed in dB? What would a million times reduction in gain be in terms of the decibel scale?

16
Antenna Gain An omni antenna has a gain of 1 or 0 dB.
Any time you focus a signal to concentrate its radiation pattern you are increasing its gain. This means that the flux density of the radiated signal will increase at the earth’s surface if you use a higher gain antenna on a satellite. The history of satellite development has been largely linked to using higher gain space antennas. The larger the aperture of an antenna the more concentrated the beam and the higher the gain. The formula for antenna gain is G=µ(pi x d)2/lambda2 in this case µ is the efficiency of the reflector, d=the diameter of the parabolic antenna reflector and lambda the wavelength. Pi=
2/lambda2 in this case µ is the efficiency of the reflector, d=the diameter of the parabolic antenna reflector and lambda the wavelength. Pi=")
17
E.I.R.P. This terms that refers to satellite irradiated power stands for Effective Isotropic Radiated Power. Isotropic refers to a signal sent in all directions equally from a single point. With a high gain antenna the power of the satellite can be radiated within specific beam coverage areas to create increased power flux density in this traffic catchment area and thus improve the communications throughput to earth stations on the ground in a particular area. The higher the EIRP it would be able to produce more power flux density on the ground

18
G/T, C/N and Eb/No G on T or Gain to Thermal Noise is a measure of the effective gain or performance of a ground station. For larger antennas this might be 32.9 dB/K for large 30m antenna to 22.9 dB/K for multi-meter antenna and for a VSAT about 8 to 12 dB/K. Carrier Signal to Noise is a measure of the transmitted power of a carrier in relation to the noise or interference in the carrier band. Eb/No is the ratio of the power per data bit to the noise power density per Hz. This is the basis for determining the quality of a digital channel. G/T on ground antenna has to consider natural temperature of earth surface not required for satellite antennas in space due to ~0’ temp.

19
System Availability and BER
The calculation of system availability is simply the ratio of the time a service or circuit is available for service to when it is not. The Integrated Services Digital Network (ISDN) standard for this is 99.98% or outage of about an hour and a half out of year. Bit Error Rate is the determination of Quality of Service QoS in a digital system. Again the ISDN Standard for BER in a simple sense is 10-6.
 standard for this is 99.98% or outage of about an hour and a half out of year. Bit Error Rate is the determination of Quality of Service QoS in a digital system. Again the ISDN Standard for BER in a simple sense is")
20
Power Flux Density Power Flux Density of a radio wave or signal that is used to measure satellite communications links. The power from the antenna radiates outwards to an ever expanding sphere until a signal is received. Thus flux density is the power flow per unit surface area. The greater the distance travel the flux density decreases by the square of the distance traveled. This is why LEO with the same antenna gain as a GEO satellite can have up to 1600 time greater flux density because it is 40 times closer to the Earth. The power flux density is thus a “vector quantity” determined by how little of a sphere’s surface it illuminates. The tighter the antenna beam the higher the received power flux density.

21
Transponders and Filters
A typical transponder bandwidth is 36 MHz but it may be 54 MHz, 72 MHz or even wider. A transponders function is to receive the signal, filter out noise, shift the frequency to a downlink frequency and then amplify it for retransmission to the ground. The main amplifier may be a Traveling Wave Tube (TWT) or Klystron Tube (now usually used for higher frequencies above 20 GHz and at very high power levels (i.e. 100 to 200 watts) or it may be a Solid State Power Amplifier (SSPA) that would be used at lower L, C or Ku band frequencies. If the transponder is a regenerative transponder then the signal will be converted to base band frequencies and processed there rather than handled at RF bands. The transponder is the device that provide the connection between the satellite’s transmit and receive antennas. Traveling Wave Tube (TWT): Klystron Tube: SSPA (Solid-State Power Amplifier): A lower powered transmitter used for amplification of RF signals at a remote site.
 or Klystron Tube (now usually used for higher frequencies above 20 GHz and at very high power levels (i.e. 100 to 200 watts) or it may be a Solid State Power Amplifier (SSPA) that would be used at lower L, C or Ku band frequencies. If the transponder is a regenerative transponder then the signal will be converted to base band frequencies and processed there rather than handled at RF bands. The transponder is the device that provide the connection between the satellite’s transmit and receive antennas. Traveling Wave Tube (TWT): Klystron Tube: SSPA (Solid-State Power Amplifier): A lower powered transmitter used for amplification of RF signals at a remote site.")
22
Intermediate and Base band Frequencies
The baseband is the frequency that is in the original source of the information such as a spoken voice. Baseband signaling involves transmission of information at its original range of frequencies. Intermediate frequencies are sometime needed too shift the baseband information through to the much higher RF signaling where satellite transmissions occur in the SHF and EHF bands.

23
Assignment Assignment 3:
Solve all the mathematical questions asked in the presentation and send the answers with the calculations steps performed to get the result. Summarize the Frequency Spectrum Diagram (on Slide 3) in terms of following table columns: Frequency Band, Operating Frequency, Commercial/Military, Satellite/Component using this frequency, Description of Application/Service, Frequencies at Risk mailto:
 in terms of following table columns: Frequency Band, Operating Frequency, Commercial/Military, Satellite/Component using this frequency, Description of Application/Service, Frequencies at Risk. mailto:")
Similar presentations