Download presentation
Presentation is loading. Please wait.

1
1 2011 Indiana Environmental Health Summit Indiana Department of Environmental Management (IDEM) June 6, 2011 Thomas W. Easterly, P.E., BCEE, QEP Commissioner, IDEM Keith Baugues, P.E. Assistant Commissioner Office of Air Quality Scott Deloney Chief, Air Programs Branch Office of Air Quality

2
Presentation Outline Overview-IDEM’s Mission and Accomplishments (Commissioner Easterly) Air Quality and Asthma Trends (Commissioner Easterly) Air Quality Standards and Where Indiana Stands (K. Baugues) Emission Trends (S. Deloney) State and Federal Actions to Improve Air Quality (S. Deloney) 2
 Emission Trends (S. Deloney) State and Federal Actions to Improve Air Quality (S. Deloney) 2.")
3
IDEM’s Mission and Accomplishments 3

4
4

5
5 IDEM’s Mission We Protect Hoosiers and Our Environment IDEM’s mission is to implement federal and state regulations to protect human health and the environment while allowing the environmentally sound operations of industrial, agricultural, commercial and government activities vital to a prosperous economy.

6
How Does IDEM Protect Hoosiers and Our Environment? Develop regulations and issue permits to restrict discharges to the environment to safe levels. Inspect and monitor permitted facilities to ensure compliance with the permits. 6

7
How Does IDEM Protect Hoosiers and Our Environment? Use compliance assistance and/or enforcement when people exceed their permit levels or violate regulations. Educate people on their environmental responsibilities. 7

8
8 Performance Metrics April 2011 Quality of Hoosiers' EnvironmentResultTargetComments % of Hoosiers in counties meeting air quality standards 99.99%100%80%Muncie Lead—675 people % of CSO Communities with approved programs to prevent the release of untreated sewage 95.4%100%20% 94+9 (103) out of 98+9 (108) % of Hoosiers receiving water from facilities in compliance with safe drinking water standards 99.6%99%95% Permitting Efficiency Total calendar days accumulated in issuing environmental permits, as determined by state statute Land 28,80966,56586,864 Air 91,841207,000385,000 Water 70,76048,000200,000 * Places emphasis on back logged permits Compliance Total percentage of compliance observations from regulated customers within acceptable compliance standards Inspections 97.36%97%75% Self reporting 94.82%99%95% Continuous monitoring (COM) 99.72%99.90%99% * Tracks observations and not just inspections
 out of 98+9 (108) % of Hoosiers receiving water from facilities in compliance with safe drinking water standards 99.6%99%95% Permitting Efficiency Total calendar days accumulated in issuing environmental permits, as determined by state statute Land 28,80966,56586,864 Air 91,841207,000385,000 Water 70,76048,000200,000 * Places emphasis on back logged permits Compliance Total percentage of compliance observations from regulated customers within acceptable compliance standards Inspections 97.36%97%75% Self reporting 94.82%99%95% Continuous monitoring (COM) 99.72%99.90%99% * Tracks observations and not just inspections")
9
9 Performance Metrics June 2005 Quality of Hoosiers' EnvironmentResultTargetComments % of Hoosiers in counties meeting air quality standards 61%100%80% 12 counties & 2,408,571 of 6,195,643 above standard % of CSO Communities with approved programs to prevent the release of untreated sewage 4%100%20%75% by 2007 is goal Permitting Efficiency Total calendar days accumulated in issuing environmental permits, as determined by state statute Land 100,01366,56586,864 Air 511,000207,000385,000 Water 301,00048,000200,000 * Places emphasis on back logged permits Compliance Total percentage of compliance observations from regulated customers within acceptable compliance standards Inspections 95.46%97%75% Self reporting 97.11%99%95% Continuous monitoring (COM) 99.19%99.90%98.95% * Tracks observations and not just inspections Organizational Transformation Budgetary agency dollars spent on key outside contracts for core agency functions. Dollars spent on outside services per year $6,179,367$0$3,447,017

10
10 (573)(650)(385) (295)(597)(467) (Total Number of Title V Permits)
(650)(385) (295)(597)(467) (Total Number of Title V Permits)")
11
25 Years of Progress At the end of 2009, for the first time since ambient air quality standards were developed, all of Indiana met all of the health based ambient air quality standards (including the 0.075 ozone standard). During 2010, the new 0.15 microgram per cubic meter lead standard became effective and almost 700 people may be breathing air above that new standard. IDEM is working to make sure that those Hoosiers have clean air to breathe. Outdoor Hydronic Heater (formerly Outdoor Wood Fired Boiler) Rule effective May 18, 2011. Automotive mercury switch removal program. 11
 Rule effective May 18, Automotive mercury switch removal program. 11.")
13
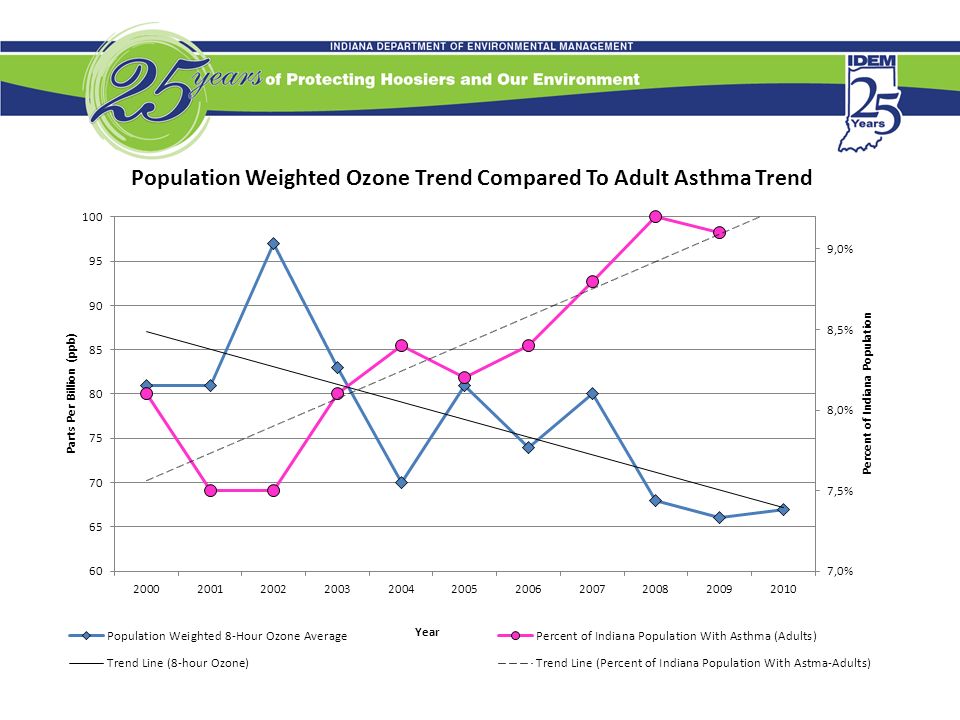
Air Quality and Asthma Trends (Statewide) 13
 13")
18
18 National Ambient Air Quality Standards (NAAQS) Where Does Indiana Stand?
 Where Does Indiana Stand")
19
19 Criteria Pollutant Trends Statewide: Lead Carbon Monoxide Particulate Matter Nitrogen Dioxide Ozone Sulfur Dioxide

20
Lead – Maximum Design Value Trends 20

21
21 October 15, 2008: U.S. EPA Established A New Lead Standard Set At 0.15 µg/m 3 As A Three Month Rolling Average. Indiana’s Nonattainment Area for Lead Based on 2007-2009 Monitoring Data

22
Carbon Monoxide (CO) – Maximum Design Value 1-Hour Trends 22
 – Maximum Design Value 1-Hour Trends 22")
23
April 3, 1971: U.S. EPA Established A CO 1-Hour Standard Set At 35 ppm January 28, 2011: U.S. EPA Proposed To Retain The CO 1-Hour Standard At 35 ppm CO 1-Hour Design Values Based on 2010 Monitoring Data 23

24
Carbon Monoxide (CO) – Maximum Design Value 8-Hour Trends 24
 – Maximum Design Value 8-Hour Trends 24")
25
April 3, 1971: U.S. EPA Established A CO 8-Hour Standard Set At 9 ppm January 28, 2011: U.S. EPA Proposed To Retain The CO 8-Hour Standard At 9 ppm CO 8-Hour Design Values Based on 2010 Monitoring Data 25

26
Fine Particle (PM2.5) – Maximum Annual Design Value Trends 26
 – Maximum Annual Design Value Trends 26")
27
July 18, 1997: U.S. EPA Established A New PM2.5 Annual Standard Set At 15 µg/m 3 PM2.5 Annual Design Values (3-yr Average) Based on 2008-2010 Monitoring Data Standard at 15 µg/m 3 27
 Based on Monitoring Data Standard at 15 µg/m")
28
March 15, 2010: U.S. EPA Announced It Would Reconsider The Annual PM2.5 Standard Within A Range Of 11-14 µg/m 3 PM2.5 Annual Design Values (3-yr Average) Based on 2008-2010 Monitoring Data Standard at 13 µg/m 3 28
 Based on Monitoring Data Standard at 13 µg/m")
29
March 15, 2010: U.S. EPA Announced It Would Reconsider The Annual PM2.5 Standard Within A Range Of 11-14 µg/m 3 PM2.5 Annual Design Values (3-yr Average) Based on 2008-2010 Monitoring Data Standard at 11 µg/m 3 29
 Based on Monitoring Data Standard at 11 µg/m")
30
Fine Particle (PM2.5) – Maximum 24-Hour Design Value Trends 30
 – Maximum 24-Hour Design Value Trends 30")
31
Based on potential revisions to the 24-hour standard. PM2.5 24-Hour Design Values (3-yr Average of 98 th Percentile) Based on 2008-2010 Monitoring Data Standard at 30 µg/m 3 31
 Based on Monitoring Data Standard at 30 µg/m")
32
Nitrogen Dioxide (NO 2 ) – Maximum Annual Design Value Trends 32
 – Maximum Annual Design Value Trends 32")
33
Nitrogen Dioxide (NO 2 ) – Maximum 1-Hour Design Value Trends 33
 – Maximum 1-Hour Design Value Trends 33")
34
1-Hour Sulfur Dioxide (SO 2 ) – Maximum 1-Hour Design Value Trends 34
 – Maximum 1-Hour Design Value Trends 34")
35
June 6, 2010: U.S. EPA Announced A New SO2 1-Hour Standard Set At 75 ppb SO2 1-Hour Design Values Based on 2008-2010 Monitoring Data Standard at 75 ppb 35

36
Indiana Preliminary Designation Recommendations SO2 1-Hour Standard 36 June 6, 2010: U.S. EPA Announced A New SO2 1-Hour Standard Set At 75 ppb

37
Ozone – Maximum Design Value Trends 37

38
March 12, 2008: U.S. EPA Announced A New Ozone 8-Hour Standard Set At 0.075 ppm Ozone 8-Hour Design Values (3-yr Average 4 th High) Based on 2008-2010 Monitoring Data Standard at 0.075 ppm 38
 Based on Monitoring Data Standard at ppm 38.")
39
January 6, 2010: U.S. EPA Announced Reconsideration Of The Ozone 8-Hour Standard (Proposed Range Of 0.060-0.070 ppm) Ozone 8-Hour Design Values (3-yr Average 4 th High) Based on 2008-2010 Monitoring Data Standard at 0.070 ppm 39
 Ozone 8-Hour Design Values (3-yr Average 4 th High) Based on Monitoring Data Standard at ppm 39.")
40
Ozone 8-Hour Design Values (3-yr Average 4 th High) Based on 2008-2010 Monitoring Data Standard at 0.065 ppm January 6, 2010: U.S. EPA Announced Reconsideration Of The Ozone 8-Hour Standard (Proposed Range Of 0.060-0.070 ppm) 40
 40.")
41
Ozone 8-Hour Design Values (3-yr Average 4 th High) Based on 2008-2010 Monitoring Data Standard at 0.060 ppm January 6, 2010: U.S. EPA Announced Reconsideration Of The Ozone 8-Hour Standard (Proposed Range Of 0.060-0.070 ppm) 41
 41.")
42
PollutantStandard 0-4 Years of Age 5-19 Years of Age Over 65 Years of AgeTotal 1-hr SO275 ppb99,372224,980155,191479,543 8-hr O370 ppb112,065262,598154,993529,656 8-hr O360 ppb303,575766,409518,4911,588,475 Annual PM2.513 ug/m3115,238268,206175,220558,664 Annual PM2.511 ug/m3253,641616,194440,3061,310,141 24-hr PM2.530 ug/m354,424140,99192,043287,458 Total 938,3152,279,3781,536,2444,753,937 Population Compared to the Current and Potential NAAQS

43
43 Emission Trends: What is Influencing Air Quality Trends? (Central Indiana)
")
44
Central Indiana Emission Trends

45
Central Indiana VOC Emission Trends Total VOC 89,881 Values are in Tons Per Year Total VOC 68,692 Total VOC 54,141

46
Central Indiana NOx Emission Trends Values are in Tons Per Year Total NOx 107,985 Total NOx 50,778 Total NOx 28,399

47
Central Indiana SO2 Emission Trends Values are in Tons Per Year Total SO2 84,001 Total SO2 43,503 Total SO2 32,201

48
Central Indiana PM2.5 Emission Trends Values are in Tons Per Year Total PM2.5 4,104 Total PM2.5 3,976

49
49 State and Federal Actions and Initiatives To Further Improve Air Quality

50
50 IDEM Initiatives to Support Future Air Quality Improvement Stage 1 vapor recovery (statewide) (LSA#07-353)-Effective Consumer and commercial products (LSA#07-351)-Final Adopted 9/10 Architectural and industrial maintenance (AIM) coatings (LSA#06-604)- Final Adopted 9/10 Outdoor hydronic heaters (LSA#05-332)-Final Adoption 3/2/2011 Automobile refinishing operations (LSA#06-603)-Effective DieselWise Indiana and VIP
 (LSA#07-353)-Effective Consumer and commercial products (LSA#07-351)-Final Adopted 9/10 Architectural and industrial maintenance (AIM) coatings (LSA#06-604)- Final Adopted 9/10 Outdoor hydronic heaters (LSA#05-332)-Final Adoption 3/2/2011 Automobile refinishing operations (LSA#06-603)-Effective DieselWise Indiana and VIP")
51
51 Anticipated Federal Regulations ActionSchedule Transport RuleProposed July 6, 2010, Final July 2011 Ozone NAAQS ReconsiderationFinal July 2011 Utility Boiler NSPS and MACTProposed March 2011, Final November 2011 Transport Rule II (NOx)Propose Summer 2011, Final Summer 2012 PM2.5 NAAQSLate 2011 or Sometime in 2012
Propose Summer 2011, Final Summer 2012 PM2.5 NAAQSLate 2011 or Sometime in 2012")
52
Air Quality and You To learn more about your air quality and what you can do to help, visit: Smogwatch.IN.gov 52

53
53 Contact Information Keith Baugues Assistant Commissioner Office of Air Quality KBaugues@idem.IN.gov (317) 232-8222 Scott Deloney Chief, Air Programs Branch Office of Air Quality Sdeloney@idem.IN.gov (317) 233-5694
 Scott Deloney Chief, Air Programs Branch Office of Air Quality (317)")
Similar presentations