Download presentation
Presentation is loading. Please wait.

1
Co-authors: Roy Brouwer, Tjasa Bole, Dolf de Groot, Salman Hussain, Onno Kuik, Alistair McVittie, Sander van der Ploeg, Peter Verburg, Alfred Wagtendonk Scaling up ecosystem service values: methodology and applications. II – Value of changes in water quality Luke Brander Institute for Environmental Studies (IVM), VU University Amsterdam Division of Environment, Hong Kong University of Science and Technology Email: lukebrander@gmail.com
, VU University Amsterdam Division of Environment, Hong Kong University of Science and Technology")
2
Outline Introduction Methodology: meta-analysis and GIS Water quality value data Water quality value function TEEB case study: global value of water quality changes Conclusions and discussion

3
Introduction Need for value information at large spatial scales (e.g. river basin) CBA of investments in water quality improvements Assess disproportionate costs Value of water quality improvements varies with body body, context and beneficiary characteristics
 CBA of investments in water quality improvements Assess disproportionate costs Value of water quality improvements varies with body body, context and beneficiary characteristics.")
4
Proposed method for scaling up values 1. Construct database of primary value estimates 2. Estimate a meta-analytic value function (including water abundance variable) 3. Construct database of water bodies using GIS 4. Estimate site-specific values for changes in water quality 5. Aggregate across relevant population and spatial level Meta- analysis Spatial Data (GIS) Estimate values
 3. Construct database of water bodies using GIS 4. Estimate site-specific values for changes in water quality 5. Aggregate across relevant population and spatial level Meta- analysis Spatial Data (GIS) Estimate values.")
5
Valuation of changes in water quality $/annum Water quality Marginal value curve Q0Q0 Q1Q1 P0P0 P1P1 Change in value

6
Water quality value data AquaMoney database of water quality values 154 contingent valuation studies (1981 – 2006) 54 with complete information for meta-analysis 388 value estimates Wide variety of descriptions of water quality change standardised to 10-point water quality index Standardised values to WTP/household/year (USD 2007 prices) Mean = 130 USD/household/year Median = 78 USD/household/year
 54 with complete information for meta-analysis 388 value estimates Wide variety of descriptions of water quality change standardised to 10-point water quality index Standardised values to WTP/household/year (USD 2007 prices) Mean = 130 USD/household/year Median = 78 USD/household/year")
7
Location of water quality value study sites

8
Ecosystem services valued Ecosystem serviceNumber of estimates Drinking water 17 Irrigation 3 Nature conservation 80 Fishing 151 Boating 128 Swimming 119 Walking 10 Other recreation 29 Health 4 Amenity 21 Non-use 275

9
Meta-analytic value function Dependent variable y: Annual WTP per household (USD 2007) Study characteristics Xsi: – Valuation method Water characteristics Xwi: – Baseline water quality – Change in water quality – Water body type Context characteristics Xci: – GCP per capita – Abundance of lakes and rivers within 10km radius – Accessibility index – Urban extent within 20km radius
 Study characteristics Xsi: – Valuation method Water characteristics Xwi: – Baseline water quality – Change in water quality – Water body type Context characteristics Xci: – GCP per capita – Abundance of lakes and rivers within 10km radius – Accessibility index – Urban extent within 20km radius")
10
Meta-analytic value function Variable nameBetaStd. Error Constant4.898***0.314 WQI_CHANGE0.081**0.032 WQI_BASE-0.0460.041 RIVER dummy-0.472***0.127 LAKE dummy-0.563***0.209 GCP 50km radius (ln)0.103***0.036 URBAN 20km radius (ln)-0.106***0.030 WATER 10km radius (ln)-0.099***0.037 ACCESS INDEX-0.416**0.204 N388
0.103***0.036 URBAN 20km radius (ln)-0.106***0.030 WATER 10km radius (ln)-0.099***0.037 ACCESS INDEX-0.416**0.204 N388.")
11
TEEB case study: global value of water quality change TEEB Quantitative Assessment Change in water quality 2000 - 2050 OECD baseline scenario of population and development IMAGE/GLOBIO model Global coverage at 50km grid cell resolution Nitrogen and phosphorous concentrations Converted to 10-point water quality index Large variation in positive and negative changes in water quality

12
Changes in water quality 2000-2050 RegionMeanRegionMean Canada -1.26 Turkey -2.51 USA -0.25 Ukraine + -1.79 Mexico -0.47 Asia-Stan -1.87 Rest Central America -1.26 Russia + -1.24 Brazil -0.82 Middle East -0.65 Rest South America -0.93 India + -2.25 Northern Africa -1.68 Korea -0.01 Western Africa -1.92 China + -1.22 Eastern Africa -2.30 South East Asia -1.32 Southern Africa -2.80 Indonesia + -1.99 Western Europe 0.91 Japan 1.30 Central Europe -0.22 Oceania -1.92

13
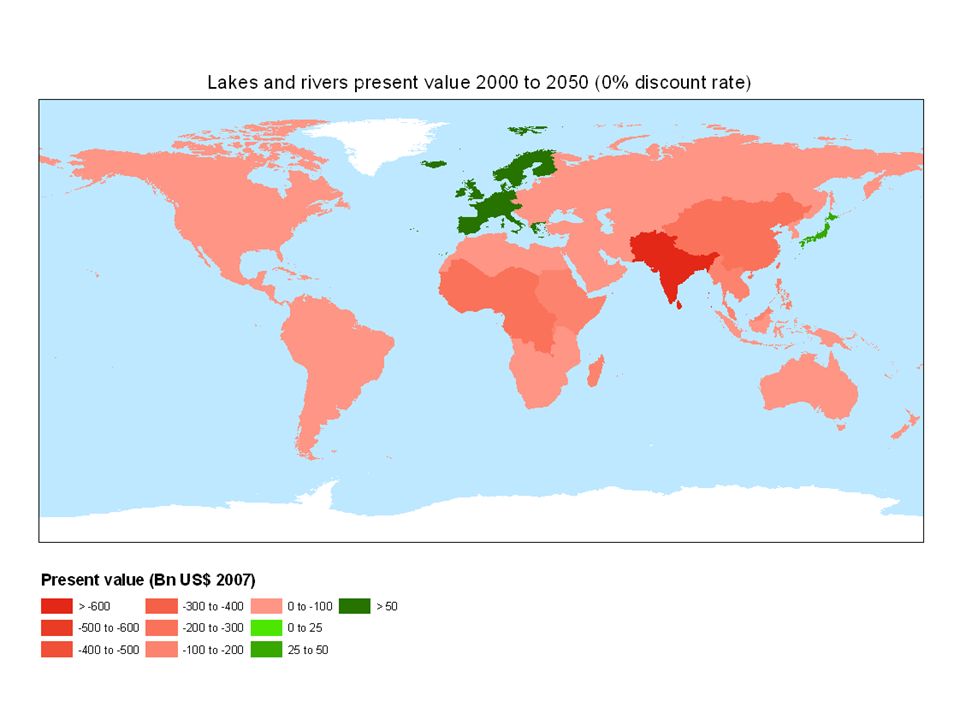
Changes in water quality 2000 - 2050 Water quality changes combined with global map of lakes and rivers Global lakes and wetlands database GLWD (1x1km grid) 375,316 water bodies (lakes and rivers) Site specific characteristics are substituted into value function Household WTP is aggregated across number of households in 50km grid cell
 375,316 water bodies (lakes and rivers) Site specific characteristics are substituted into value function Household WTP is aggregated across number of households in 50km grid cell")
14
RegionAnnual valueRegionAnnual value Canada -0.46 Turkey -0.96 USA -0.56 Ukraine + -1.07 Mexico -1.21 Asia-Stan -0.62 Central America -0.96 Russia + -1.32 Brazil -2.11 Middle East -0.91 Rest South America -2.43 India + -25.23 Northern Africa -1.90 Korea -0.22 Western Africa -8.65 China + -8.02 Eastern Africa -3.93 South East Asia -4.55 Southern Africa -3.75 Indonesia + -3.52 Western Europe 2.17 Japan 1.60 Central Europe -0.21 Oceania -0.53 World -69 Annual values in 2050 (billions USD 2007)
")
19
Discussion and conclusions Value transfer on a large scale –GIS to account for spatial variation –Scale, substitutes, and income effects Limitations: –Does not produce service specific values –Partial valuation: value data is focussed on recreational uses –Partly accounts for changes in water quantity –Restricted measure of water quality –Difficult to identify relevant population for aggregation

Similar presentations


 The role of virtual water transfer in water management.>")
![1 July 2008 e Global summary of the AIDS epidemic, December 2007 Total33 million [30 – 36 million] Adults30.8 million [28.2 – 34.0 million] Women15.5 million.](/23/6641248/big_thumb.jpg "1 July 2008 e Global summary of the AIDS epidemic, December 2007 Total33 million [30 – 36 million] Adults30.8 million [28.2 – 34.0 million] Women15.5 million.>")


