Download presentation
Presentation is loading. Please wait.

1
Computer lab: problems 2.11 and 2.12 tom.h.wilson tom.wilson@mail.wvu.edu Department of Geology and Geography West Virginia University Morgantown, WV

2
Objectives for the day Background on the North Sea Data Determining sedimentations rates from age-depth data Estimating the time when sedimentation ceased or the age of the surface at “0” depth. Working with liquid fraction/concentration data Using absolute references and Excel constants to build formulas go over problem presentation formats

3
We didn’t talk much about derivatives, but we will spend time on differential and integral calculus later in the semester. The problem asked on the warm up sheet requires that you use the power rule, so hopefully you didn’t find that one too difficult.

4
When the ocean temperature cools O 16 preferentially evaporates

5
Thus ice formed during colder periods will have less O 18, while the creatures with carbonate skeletal material will contain increased amounts of O 18 O 18 drops in the ice But rises in organisms living in the colder oceans

6
Lehman and Keigwin undertook one of the first deep sea studies to document changes in sea surface temperature associated with deglaciation O 18 from plankton

7
Waltham presents us with a small portion of the total data set, just to illustrate some basic ideas.

8
How do you bring in your data? How do you plot your data? How can you change the plot line style (color, thickness, continuous or dashed…)? How can you change the data point display style (marker line style, line color, …)? How do you get back to the Chart Tools? How do you change the chart layout? How do you format gridlines, chart axes? How can you add a chart title? How do you move the graph around in the chart window? What are the three tabs available under Chart Tools?
. How can you change the data point display style (marker line style, line color, …). How do you get back to the Chart Tools. How do you change the chart layout. How do you format gridlines, chart axes. How can you add a chart title. How do you move the graph around in the chart window. What are the three tabs available under Chart Tools .")
9
You’ll have an opportunity before you leave to print of a plot

10
See handout Ctrl C to cut graphs & Ctrl V to paste Print Screen to capture entire monitor view Fn+Alt+Print Screen to capture the active dialog window Ctrl V to paste

12
Evaluate the logs of these two functions What base do you need to use?

13
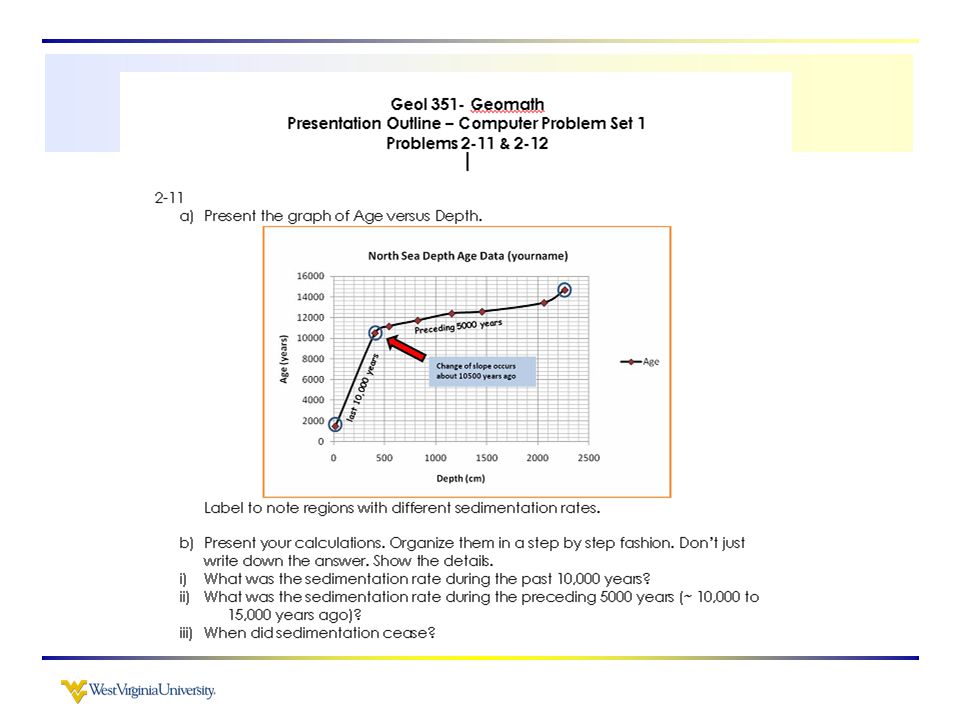
Does the age depth relationship in the North Sea suggest that an exponential age/depth relationship exists in the area? Put it to the test in Excel- If the relationship follows an exponential growth function, then the ln or log of Age should transform the relationship into a linear one.

14
C 0 is the initial concentration of the element in the liquid before crystallization began, F is the fraction of liquid remaining and D is a constant (known as the distribution coefficient). Calculate the concentration of an element after 50% crystallization (i.e. F = 0.5) if its initial concentration was 200ppm and D=6.5.
 if its initial concentration was 200ppm and D=6.5..")
15
We’re going to take a slightly different approach to the solution of Problem 2.12 that will take advantage of the computer resources and provide a more comprehensive evaluation of the concentration liquid fraction relationship. Rather than solving C for just one value of F let's solve C for a range of Fs extending from 0 to 1 at intervals of 0.05.

16
F is our independent variable, so for starters, we need to create a column of numbers corresponding to remaining liquid fraction that run from 0 to 1 at intervals of 0.05

17
Select, Click and Drag Down to Fill

18
Assign a variable name

19
In cell B2 enter the formula =CO*A2^(D-1)
")
20
1.Present your graph. 2.Present hand calculations of the concentration after 50% crystallization. 3.Using your calculated data tables compare the change in concentration from 85% to 75% liquid fraction with that occurring between 55% and 45%

21
As the result of today’s lab you should know how to do the following: Enter data Graph data Format and style graphical output for presentation Transform exponential functions into linear functions Assign variable names to specific cells in Excel

22
How do you bring in your data? How do you plot your data? How can you change the plot line style (color, thickness, continuous or dashed…)? How can you change the data point display style (marker line style, line color, …)? How do you get back to the Chart Tools? How do you change the chart layout? How do you format gridlines, chart axes? How can you add a chart title? How do you move the graph around in the chart window? What are the three tabs available under Chart Tools?
. How can you change the data point display style (marker line style, line color, …). How do you get back to the Chart Tools. How do you change the chart layout. How do you format gridlines, chart axes. How can you add a chart title. How do you move the graph around in the chart window. What are the three tabs available under Chart Tools .")
25
On the class web page see http://www.geo.wvu.edu/~wilson/geomath/lab1/PresentationOutlineCPS1.pdf

26
Hand in Warm-Up 2 problems Today Hand in problems 2.11 and 2.12 on Thursday Look over problem 2.13 for Thursday Bring Questions and Continue your reading For today and Thursday ….

Similar presentations


 is a two-dimensional array of cells containing data to be.>")


