Download presentation
Presentation is loading. Please wait.

1
Business Research Methods William G. Zikmund Chapter 21: Univariate Statistics

2
Copyright © 2000 by Harcourt, Inc. All rights reserved. Requests for permission to make copies of any part of the work should be mailed to the following address: Permissions Department, Harcourt, Inc., 6277 Sea Harbor Drive, Orlando, Florida 32887-6777.

3
Copyright © 2000 by Harcourt, Inc. All rights reserved. UNIVARIATE STATISTICS TEST OF STATISTICAL SIGNIFICANCE HYPOTHESIS TESTING ONE VARIABLE AT A TIME

4
Copyright © 2000 by Harcourt, Inc. All rights reserved. HYPOTHESIS UNPROVEN PROPOSITION SUPPOSITION THAT TENATIVELY EXPLAINS CERTAIN FACTS OR PHENOMONA ASSUMPTION ABOUT NATURE OF THE WORLD

5
Copyright © 2000 by Harcourt, Inc. All rights reserved. HYPOTHESIS AN UNPROVEN PROPOSITION OR SUPPOSITION THAT TENTATIVELY EXPLAINS CERTAIN FACTS OF PHENOMENA NULL HYPOTHESIS ALTERNATIVE HYPOTHESIS

6
Copyright © 2000 by Harcourt, Inc. All rights reserved. NULL HYPOTHESIS STATEMENT ABOUT THE STATUS QUO NO DIFFERENCE

7
Copyright © 2000 by Harcourt, Inc. All rights reserved. ALTERNATIVE HYPHOTESIS STATEMENT THAT INDICATES THE OPPOSITE OF THE NULL HYPOTHESIS

8
Copyright © 2000 by Harcourt, Inc. All rights reserved. SIGNIFICANCE LEVEL CRITICAL PROBABLITY IN CHOOSING BETWEEN THE NULL HYPOTHESIS AND THE ALTERNATIVE HYPOTHESIS

9
Copyright © 2000 by Harcourt, Inc. All rights reserved. SIGNIFICANCE LEVEL CRITICAL PROBABLITY CONFIDENCE LEVEL ALPHA PROBABLITY LEVEL SELECTED IS TYPICALLY.05 OR.01 TOO LOW TO WARRANT SUPPORT FOR THE NULL HYPOTHESIS

10
Copyright © 2000 by Harcourt, Inc. All rights reserved. The null hypothesis that the mean is equal to 3.0:

11
Copyright © 2000 by Harcourt, Inc. All rights reserved. The alternative hypothesis that the mean does not equal to 3.0:

12
Copyright © 2000 by Harcourt, Inc. All rights reserved. A SAMPLING DISTRIBUTION

13
Copyright © 2000 by Harcourt, Inc. All rights reserved. A SAMPLING DISTRIBUTION

14
Copyright © 2000 by Harcourt, Inc. All rights reserved. A SAMPLING DISTRIBUTION LOWER LIMIT UPPER LIMIT

15
Copyright © 2000 by Harcourt, Inc. All rights reserved. Critical values of Critical value - upper limit

16
Copyright © 2000 by Harcourt, Inc. All rights reserved. Critical values of

17
Copyright © 2000 by Harcourt, Inc. All rights reserved. Critical values of Critical value - lower limit

18
Copyright © 2000 by Harcourt, Inc. All rights reserved. Critical values of

19
Copyright © 2000 by Harcourt, Inc. All rights reserved. REGION OF REJECTION LOWER LIMIT UPPER LIMIT

20
Copyright © 2000 by Harcourt, Inc. All rights reserved. HYPOTHESIS TEST 2.804 3.196 3.78

21
Copyright © 2000 by Harcourt, Inc. All rights reserved. TYPE I AND TYPE II ERRORS Accept nullReject null Null is true Null is false Correct- no error Type I error Type II errorCorrect- no error

22
Copyright © 2000 by Harcourt, Inc. All rights reserved. Type I and Type II Errors in Hypothesis Testing State of Null Hypothesis Decision in the PopulationAccept HoReject Ho Ho is trueCorrect--no errorType I error Ho is falseType II errorCorrect--no error

23
Copyright © 2000 by Harcourt, Inc. All rights reserved. CALCULATING Z OBS

24
Copyright © 2000 by Harcourt, Inc. All rights reserved. Alternate way of testing the hypothesis

25
Copyright © 2000 by Harcourt, Inc. All rights reserved. Alternate way of testing the hypothesis

26
Copyright © 2000 by Harcourt, Inc. All rights reserved. CHOOSING THE APPROPRAITE STATISTICAL TECHNIQUE Type of question to be answered Number of variables –Univariate –Bivariate –Multivariate Scale of measurement

27
Copyright © 2000 by Harcourt, Inc. All rights reserved. PARAMETRIC STATISTICS NONPARAMETRIC STATISTICS

28
Copyright © 2000 by Harcourt, Inc. All rights reserved. t-distribution Symmetrical, bell-shaped distribution Mean of zero and a unit standard deviation Shape influenced by degrees of freedom

29
Copyright © 2000 by Harcourt, Inc. All rights reserved. DEGREES OF FREEDOM Abbreviated d.f. Number of observations Number of constraints

30
Copyright © 2000 by Harcourt, Inc. All rights reserved. or Confidence interval estimate using the t-distribution

31
Copyright © 2000 by Harcourt, Inc. All rights reserved. = population mean = sample mean = critical value of t at a specified confidence level = standard error of the mean = sample standard deviation = sample size Confidence interval estimate using the t-distribution

32
Copyright © 2000 by Harcourt, Inc. All rights reserved. Confidence Interval using t

33
Copyright © 2000 by Harcourt, Inc. All rights reserved.

35
HYPOTHESIS TEST USING THE t-DISTRIBUTION

36
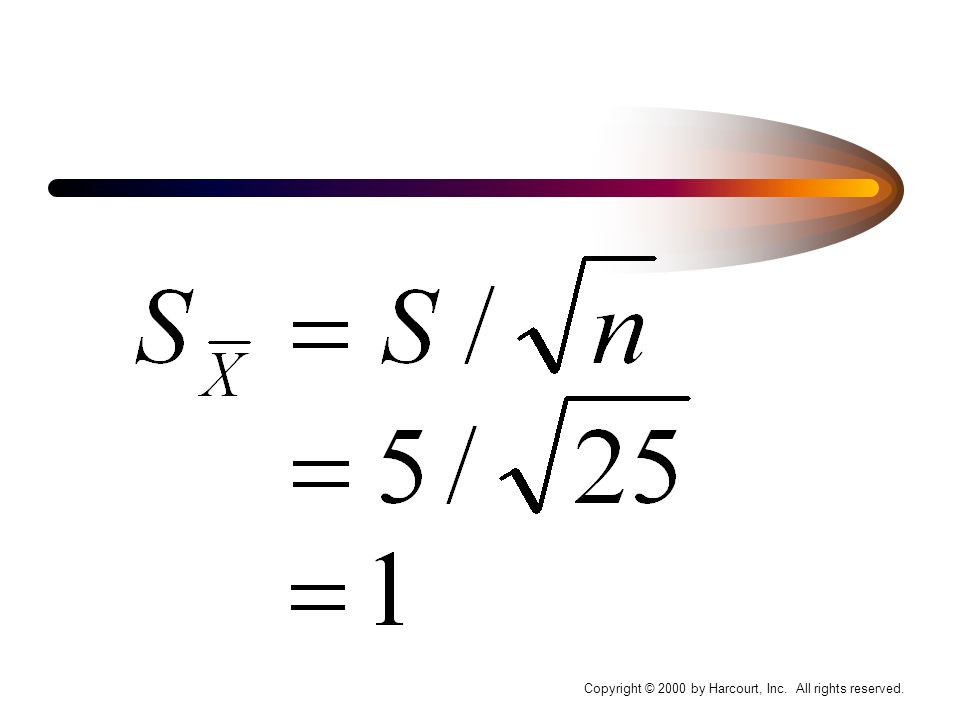
Copyright © 2000 by Harcourt, Inc. All rights reserved. Univariate hypothesis test utilizing the t-distribution Suppose that a production manager believes the average number of defective assemblies each day to be 20. The factory records the number of defective assemblies for each of the 25 days it was opened in a given month. The mean was calculated to be 22, and the standard deviation,,to be 5.

37
Copyright © 2000 by Harcourt, Inc. All rights reserved.

39
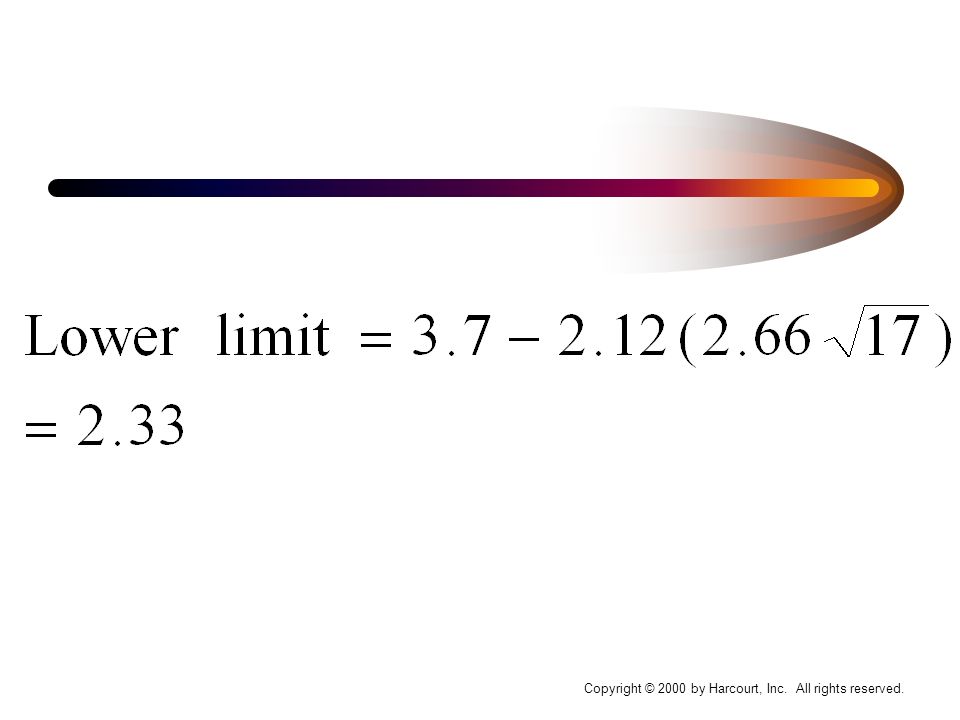
Univariate hypothesis test utilizing the t-distribution The researcher desired a 95 percent confidence, and the significance level becomes.05.The researcher must then find the upper and lower limits of the confidence interval to determine the region of rejection. Thus, the value of t is needed. For 24 degrees of freedom (n-1, 25-1), the t-value is 2.064.
, the t-value is")
40
Copyright © 2000 by Harcourt, Inc. All rights reserved.

42
Univariate hypothesis test - t-test

43
Copyright © 2000 by Harcourt, Inc. All rights reserved. TESTING A HYPOTHESIS ABOUT A DISTRIBUTION CHI-SQUARE TEST TEST FOR SIGNIFANCE IN THE ANALYSIS OF FREQUENCY DISTRIBUTIONS COMPARE OBSERVED FREQUENCIES WITH EXPECTED FREQUENCIES “GOODNESS OF FIT”

44
Copyright © 2000 by Harcourt, Inc. All rights reserved. Chi-Square Test

45
Copyright © 2000 by Harcourt, Inc. All rights reserved. Chi-Square Test x² = chi-square statistics O i = observed frequency in the i th cell E i = expected frequency on the i th cell

46
Copyright © 2000 by Harcourt, Inc. All rights reserved. Chi-Square Test - estimation for expected number for each cell

47
Copyright © 2000 by Harcourt, Inc. All rights reserved. Chi-Square Test - estimation for expected number for each cell R i = total observed frequency in the i th row C j = total observed frequency in the j th column n = sample size

48
Copyright © 2000 by Harcourt, Inc. All rights reserved. Univariate hypothesis test - Chi-square Example

49
Copyright © 2000 by Harcourt, Inc. All rights reserved. Univariate hypothesis test - Chi-square Example

50
Copyright © 2000 by Harcourt, Inc. All rights reserved. HYPOTHESIS TEST OF A PROPORTION is the population proportion p is the sample proportion is estimated with p

51
Copyright © 2000 by Harcourt, Inc. All rights reserved. Hypothesis Test of a Proportion 5. :H 5. :H 1 0

52
Copyright © 2000 by Harcourt, Inc. All rights reserved.

54
0115.S p 000133.S p 1200 16. S p 1200 )8)(.2(. S p n pq S p 20.p 200,1n Hypothesis Test of a Proportion: Another Example

55
Copyright © 2000 by Harcourt, Inc. All rights reserved. Indeed.001 the beyond t significant is it level..05 the at rejected be should hypothesis null the so 1.96, exceeds value Z The 348.4Z 0115. 05. Z 0115. 15.20. Z S p Z p Hypothesis Test of a Proportion: Another Example

Similar presentations


 Parameter Estimation of PDF and Fitting a Distribution Function.>")
 There are two types of hypothesis : 1) Simple hypothesis :A statistical.>")


 p-Value Approach to Hypothesis Testing.>")


 Hypothesis Testing with Sample.>")


