Download presentation
Presentation is loading. Please wait.

1
Introduction to 2012 Census of Agriculture Data for Oklahoma Damona Doye damona.doye@okstate.edu Rainbolt Chair of Agricultural Finance Extension Economist and Regents Professor OSU Agricultural Economics Department

2
Number of Oklahoma Farmers Operators20072012% change Principal 86,565 80,245 -7.3% Second 38,312 36,106 -5.8% Third 4,725 4,097 -13.3% All 129,602 120,448 -7.1% 2012 USDA Census of Agriculture

3
20072012 % change On operation less than 10 years 25,686 19,873 -22.6% On operation less than 5 years 9,968 7,246 -27.3% New OK Farmers (number of principal operators) 2012 USDA Census of Agriculture
 2012 USDA Census of Agriculture")
4
Distribution of Oklahoma Farms by County, 2012 366 to 659 660 to 953 1,542 to 1,835 1,248 to 1,541 1,836 to 2,121 954 to 1,247 N/A 2012 USDA Census of Agriculture

5
Change in Number of Farms, 2007 to 2012 No change Decrease (0 to -5%) Large Decrease (-10% to -25%) Increase (0 to 5%) Significant Decrease (-5% to -10%) Significant Increase (5% to 10%) Large Increase (10% to 25%) 2012 USDA Census of Agriculture
 Large Decrease (-10% to -25%) Increase (0 to 5%) Significant Decrease (-5% to -10%) Significant Increase (5% to 10%) Large Increase (10% to 25%) 2012 USDA Census of Agriculture")
6
Oklahoma Farms by Legal Status, 2012

7
2012 USDA Census of Agriculture Average Age of Principal Operator in OK, 1982-2012

8
Operator20072012% change Principal57.658.31.2% Second51.553.13.1% Third43.644.62.3% All55.356.21.6% Average Age of Farm Operators (years) 2012 USDA Census of Agriculture
 2012 USDA Census of Agriculture")
10
Average Age of Principal Farm Operator, 2012 55-55.9 56-56.9 58-58.9 59-59.9 Under 55 57-57.9 60 and over 2012 USDA Census of Agriculture

11
OK Farm Operator Age Distribution 2012 USDA Census of Agriculture

12
Oklahoma Farm Operator Distribution by Primary Occupation 2012 USDA Census of Agriculture

13
Gender, Primary Occupation, and Years on Farm, 2012 Farm OperatorsGenderPrimary OccupationYears on Farm (number)MaleFemaleFarmOther<1010+ Principal 71,169 9,076 33,790 46,455 15,854 64,391 Second 8,190 27,916 11,229 24,877 10,095 26,011 Third 2,416 1,681 1,372 2,725 1,910 2,187 All 81,775 38,673 46,391 74,057 27,859 92,589 (percent) Principal 88.7%11.3%42.1%57.9%19.8%80.2% Second 22.7%77.3%31.1%68.9%28.0%72.0% Third 59.0%41.0%33.5%66.5%46.6%53.4% All 67.9%32.1%38.5%61.5%23.1%76.9% Years on farm are from "years operating any farm" Gender numbers do not include spouses 2012 USDA Census of Agriculture
MaleFemaleFarmOther<1010+ Principal 71,169 9,076 33,790 46,455 15,854 64,391 Second 8,190 27,916 11,229 24,877 10,095 26,011 Third 2,416 1,681 1,372 2,725 1,910 2,187 All 81,775 38,673 46,391 74,057 27,859 92,589 (percent) Principal 88.7%11.3%42.1%57.9%19.8%80.2% Second 22.7%77.3%31.1%68.9%28.0%72.0% Third 59.0%41.0%33.5%66.5%46.6%53.4% All 67.9%32.1%38.5%61.5%23.1%76.9% Years on farm are from years operating any farm Gender numbers do not include spouses 2012 USDA Census of Agriculture")
14
Farms with Principal Operators whose Primary Occupation is Not Farming, by County, 2012 40 to 49% 50 to 54% 60 to 64% 65 to 69% NA 55 to 59% 2012 USDA Census of Agriculture

16
Female and Male Farmers 20072012% change Female Operators Principal 10,849 9,076-16.3% All 42,062 38,673-8.1% Male Operators Principal 75,716 71,169-6.0% All 87,540 81,775-6.6% 2012 USDA Census of Agriculture

17
Farms with Female Principal Operator, by County, 2012 <5% 5-9% 15-19% 20-25% NA 10-14% 2012 USDA Census of Agriculture

22
Distribution of Farms by Value of Sales 2012 USDA Census of Agriculture

24
Sales ($1,000) % of OK Total Texas1,013,92114.2% Cimarron376,6595.3% LeFlore287,2934.0% Delaware254,3993.6% Beaver186,9902.6% Alfalfa168,5372.4% Adair164,2192.3% McCurtain163,1442.3% Kingfisher161,8252.3% Garfield151,7862.1% Top 10 Counties in Agricultural Sales 2012 USDA Census of Agriculture
 % of OK Total Texas1,013, % Cimarron376,6595.3% LeFlore287,2934.0% Delaware254,3993.6% Beaver186,9902.6% Alfalfa168,5372.4% Adair164,2192.3% McCurtain163,1442.3% Kingfisher161,8252.3% Garfield151,7862.1% Top 10 Counties in Agricultural Sales 2012 USDA Census of Agriculture")
25
Ag Sales by County, 2012 ($1,000) 26,000 to 50,000 51,000 to 75,000 126,000 to 150,000 151,000 and up 76,000 to 100,000 10,000 to 25,000 101,000 to 125,000 2012 USDA Census of Agriculture
 26,000 to 50,000 51,000 to 75, ,000 to 150, ,000 and up 76,000 to 100,000 10,000 to 25, ,000 to 125, USDA Census of Agriculture")
28
Crop Sales as a Percent of Ag Sales, by County 11-20% 21-30% 56-70% 41-55% 71% and up 31-40% 0-10% 2012 USDA Census of Agriculture

29
Value of Grains and Oilseeds as Percent of Total Value Sold, 2012 Less than 10% 10-19% 35-49% 50-69% NA 20-34% 70% or more 2012 USDA Census of Agriculture

32
Distribution of Oklahoma Farms by Acreage and Production Specialty 2012 USDA Census of Agriculture

33
20072012% change Agricultural sales5,806,0617,129,58422.8 Government payments209,465256,84522.6 Farm-related income236,684251,1686.12 Production expenses5,223,3656,682,76927.9 Net cash farm income1,028,845954,827-7.2 Oklahoma Farm Income and Expenses ($1,000) 2012 USDA Census of Agriculture
 2012 USDA Census of Agriculture")
34
Income and Expenses, OK per farm average ($) 20072012% change Agricultural Sales67,07288,848 32.5 Govt. payments7,7548,634 11.3 Farm-related income13,70511,690 -14.7 Production expenses60,34083,280 38.0 Net cash farm income11,88511,899 0.1 2012 USDA Census of Agriculture

35
Agricultural Production Expenses ($1,000) 20072012% change Total5,223,3656,682,76927.9 Feed1,307,5682,017,04954.3 Livestock and poultry purchases1,463,5561,696,66215.9 Fertilizer286,976352,95023.0 Hired labor255,062309,65721.4 Cash rent167,558237,04241.5 Seeds78,039138,35177.3 Supplies and repairs350,931356,7261.7 Gas, fuel, and oils316,477351,18011.0 Chemicals90,112169,20687.8 Other258,996292,40312.9 2012 USDA Census of Agriculture
 % change Total5,223,3656,682, Feed1,307,5682,017, Livestock and poultry purchases1,463,5561,696, Fertilizer286,976352, Hired labor255,062309, Cash rent167,558237, Seeds78,039138, Supplies and repairs350,931356, Gas, fuel, and oils316,477351, Chemicals90,112169, Other258,996292, USDA Census of Agriculture")
36
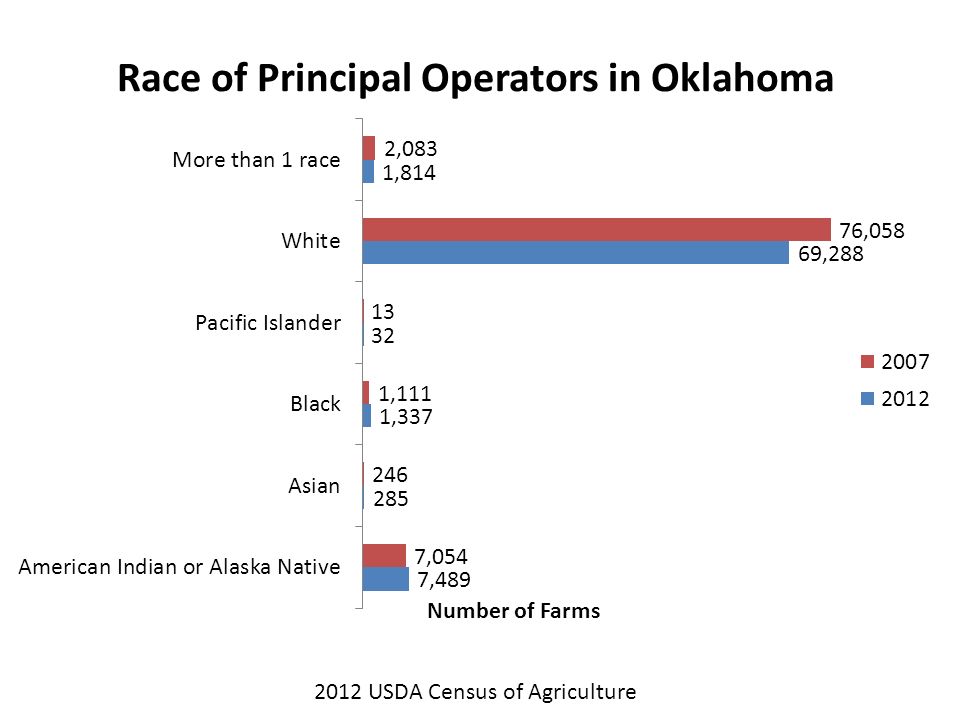
Share of Farms by Sales Class for Race of Principal Operator, 2012 AnnualAllAmericanNative More than salesFarmsIndianBlackAsianHawaiianWhiteone race Less than $1,000 22.6%25.4%31.1%20.4%40.6%22.2%21.3% $1,000 to $2,499 10.1%11.2%10.4%6.7%6.3%9.9%11.2% $2,500 to $4,999 11.4%12.7%16.5%14.0%12.5%11.2%11.7% $5,000 to $9,999 13.1%14.5%15.3%10.2%6.3%12.9%13.0% $10,000 to $24,999 16.3%17.9%16.2%4.2%6.3%16.1%17.9% $25,000 to $49,999 9.1%8.4%5.2%5.6%3.1%9.2%9.6% $50,000 or more 17.4%9.9%5.3%38.9%25.0%18.4%15.4% Total 100.0% 2012 USDA Census of Agriculture

39
Selected Characteristics of Principal Operators 2012% of % change (Number) Principal Operators since 2007 Agriculture sales under $50,000 67,013 83.5%-10.5% Agriculture sales under $10,000 47,506 59.2%-12.8% Lived on their farms 61,952 77.2%-6.1% Less than 25% of household income came from farming 61,937 77.2%-7.5% Had internet access 53,602 66.8%16.7% Worked some days off the farm 52,399 65.3%-7.8% Had a primary occupation other than farming 46,455 57.9%-8.0% Had a positive net cash income for the operation 30,446 37.9%-9.7% 2012 USDA Census of Agriculture
 Principal Operators since 2007 Agriculture sales under $50,000 67, %-10.5% Agriculture sales under $10,000 47, %-12.8% Lived on their farms 61, %-6.1% Less than 25% of household income came from farming 61, %-7.5% Had internet access 53, %16.7% Worked some days off the farm 52, %-7.8% Had a primary occupation other than farming 46, %-8.0% Had a positive net cash income for the operation 30, %-9.7% 2012 USDA Census of Agriculture")
40
Farmland as a Percent of Land Area, 2012 20-49% 50-59% 70-79% 80-89% NA 60-69% 90% or more 2012 USDA Census of Agriculture

41
Acres of Irrigated Land as Percent of Land in Farms, 2012 0-0.5% 1.5-3% 3% or more NA 0.5-1.5% 2012 USDA Census of Agriculture

42
Change in Land in Farms, 2007 to 2012 No change Decrease (0 to -5%) Larger Decrease (-10% to -25%) Increase (0 to 5%) Significant Decrease (-5% to -10%) Significant Increase (5% to 10%) Larger Increase (10% to 25%) 2012 USDA Census of Agriculture
 Larger Decrease (-10% to -25%) Increase (0 to 5%) Significant Decrease (-5% to -10%) Significant Increase (5% to 10%) Larger Increase (10% to 25%) 2012 USDA Census of Agriculture")
43
$74,212: Average value of machinery and equipment on an Oklahoma farm in 2012 2012 USDA Census of Agriculture

44
Resources and Contact Info USDA Census of Agriculture – http://www.agcensus.usda.gov/Publications/2012/ damona.doye@okstate.edu, 405-744-9813 damona.doye@okstate.edu

49
Questions?

Similar presentations


 and.>")


