Download presentation
Presentation is loading. Please wait.

1
Landscape-scale forest carbon measurements for reference sites: The role of Remote Sensing Nicholas Skowronski USDA Forest Service Climate, Fire and Carbon cycle science Silas Little Experimental Forest

2
Outline Background in Remote Sensing Background in Remote Sensing Remote sensing in the context of carbon measurements Remote sensing in the context of carbon measurements Basic LiDAR data processing steps Basic LiDAR data processing steps Focus on LiDAR work at NJ Tier 3 sites and beyond. Focus on LiDAR work at NJ Tier 3 sites and beyond.

3
Types of Remote Sensing observations Passive Sensors – Spectral Reflectance (sun source) Passive Sensors – Spectral Reflectance (sun source) Active Sensors – Reflectance and Echo (sensor source) Active Sensors – Reflectance and Echo (sensor source)
 Passive Sensors – Spectral Reflectance (sun source) Active Sensors – Reflectance and Echo (sensor source) Active Sensors – Reflectance and Echo (sensor source)")
4
Resolution Spatial Resolution: How small an object do you need to see (pixel size) and how large an area do you need to cover? Spatial Resolution: How small an object do you need to see (pixel size) and how large an area do you need to cover? Spectral Resolution: What part of the spectrum do you want to measure? Spectral Resolution: What part of the spectrum do you want to measure? Radiometric Resolution: How finely (precisely) do you need to quantify the data? Radiometric Resolution: How finely (precisely) do you need to quantify the data? Temporal Resolution: How often do you need to measure? Temporal Resolution: How often do you need to measure?
 and how large an area do you need to cover. Spectral Resolution: What part of the spectrum do you want to measure. Spectral Resolution: What part of the spectrum do you want to measure. Radiometric Resolution: How finely (precisely) do you need to quantify the data. Radiometric Resolution: How finely (precisely) do you need to quantify the data. Temporal Resolution: How often do you need to measure. Temporal Resolution: How often do you need to measure .")
5
GOES MODIS LiDAR, RADAR Landsat, EO-1 IKONOS, Quickbird Adapted from : Chambers et al. 2007

6
From: Hostert et al. 2010

7
Remote Sensing in the Context of Carbon Measurements Land use and land cover Change Land use and land cover Change Phenological cycles Phenological cycles Canopy chemistry Canopy chemistry Crown detection and species identification Crown detection and species identification Forest biomass Forest biomass Forest structural attributes Forest structural attributes

8
Land Use Change Landsat TM and Landsat ETM Landsat TM and Landsat ETM ca. 30 m vertical resolution ca. 30 m vertical resolution 16 day temporal resolution 16 day temporal resolution 8 spectral bands 8 spectral bands From: Lathrop et al. 2009

9
Monthly phenology (as illustrated by various vegetation indices) for a single MODIS pixel in 2005 at Harvard Forest, MA, USA. Reed et al. 2009 Phenology MODIS MODIS ca. 1 km vertical resolution ca. 1 km vertical resolution 1 day temporal resolution 1 day temporal resolution 36 spectral bands 36 spectral bands

10
Foliar nitrogen and canopy water in Hawaii Volcanoes National Park from AVRIS. Asner and Vitousek (2005) Canopy Chemistry AVRIS AVRIS ca. 17 m vertical resolution ca. 17 m vertical resolution Aircraft-borne Aircraft-borne 224 spectral bands 224 spectral bands
 Canopy Chemistry AVRIS AVRIS ca. 17 m vertical resolution ca. 17 m vertical resolution Aircraft-borne Aircraft-borne 224 spectral bands 224 spectral bands.")
11
Lee et al. 2010 Individual Crown Delineation Discrete-return scanning LiDAR Discrete-return scanning LiDAR 4 pulses m -2 4 pulses m -2 Aircraft-borne Aircraft-borne “Return Cloud” filtered “Return Cloud” filtered

12
(a)LiDAR-derived maximum canopy height. (b)Aboveground live tree carbon Gonzalez et al. 2010 Short et al. Landscape-scale Forest Biomass Discrete-return scanning LiDAR Discrete-return scanning LiDAR 4 pulses m-2 4 pulses m-2 Aircraft-borne Aircraft-borne “Return Cloud” filtered “Return Cloud” filtered

13
Kellndorfer et al. 2010 Statistical Data Fusion for regional forest height mapping. Regional-scale Forest Biomass Data-fusion approach Data-fusion approach LiDAR and Spectral Data LiDAR and Spectral Data

14
Falkowski et al. 2009 Forest Structural Attributes Discrete-return scanning LiDAR or full-waveform LIDAR Discrete-return scanning LiDAR or full-waveform LIDAR Varying data intensity Varying data intensity Aircraft-borne or backpack borne Aircraft-borne or backpack borne

15
LiDAR work at the NJ Tier 3 sites LiDAR background LiDAR background Calibration using plot-level data Calibration using plot-level data Landscape-level carbon storage Landscape-level carbon storage Change Detection Change Detection Characterization of Canopy Structure Characterization of Canopy Structure

16
LiDAR Basics

17
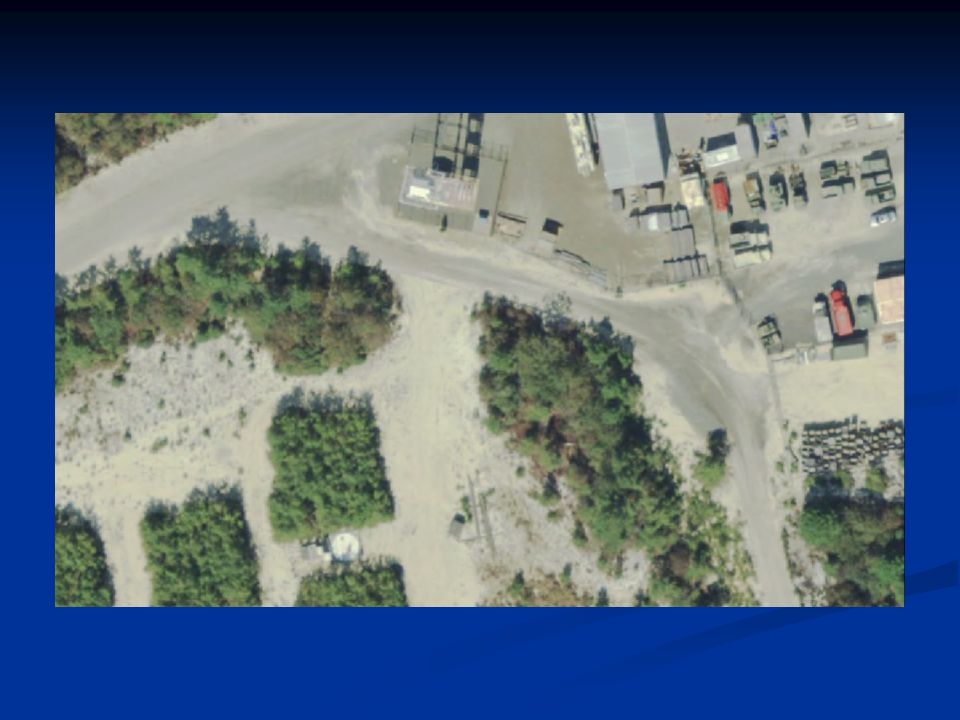
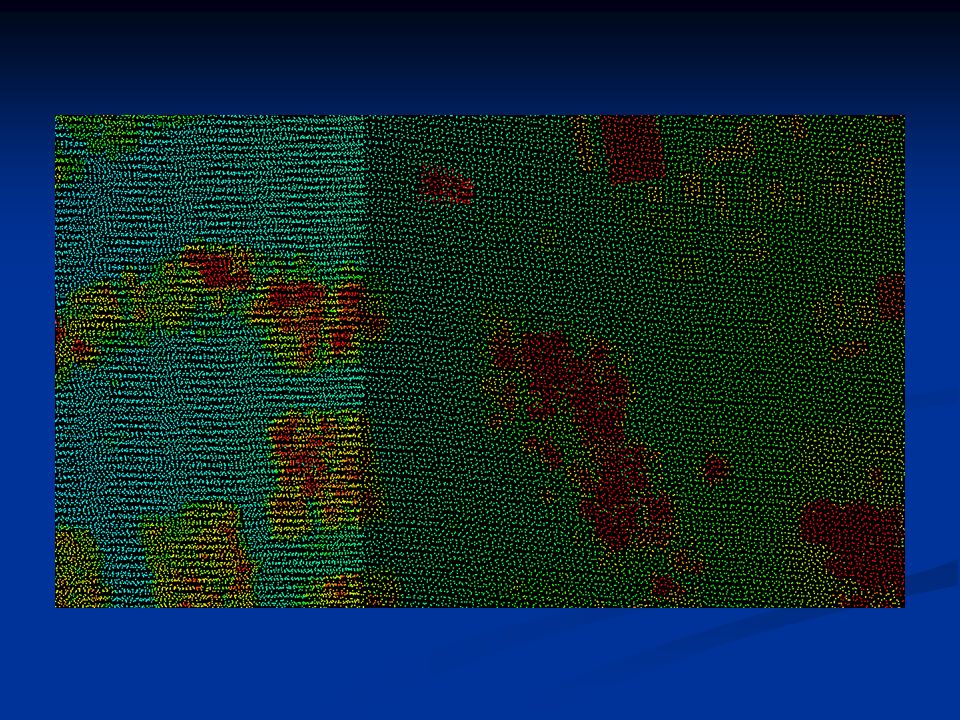
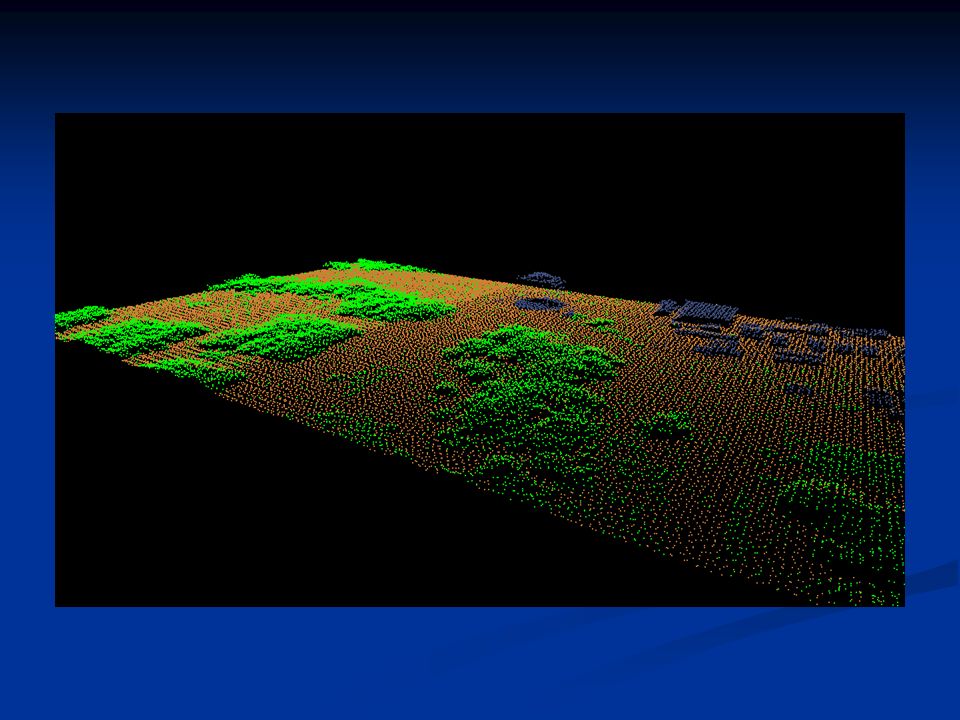
Filtering LiDAR returns “Point cloud” that has individual LiDAR returns as x, y and z co-ordinates “Point cloud” that has individual LiDAR returns as x, y and z co-ordinates

22
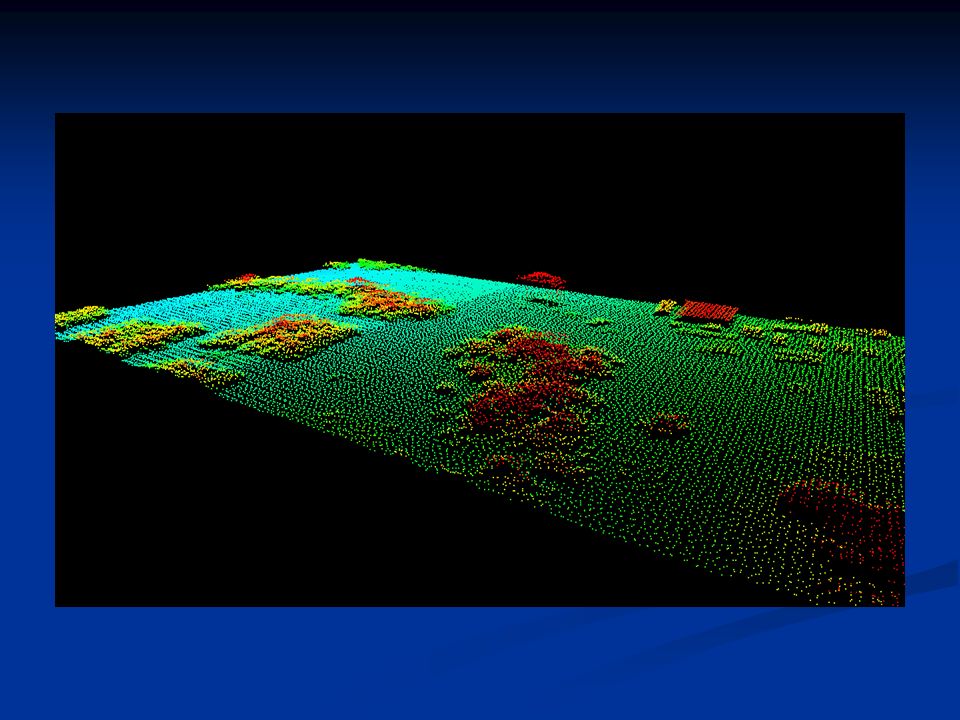
Filtering and Classifying LiDAR returns Start with a point cloud that has individual LiDAR returns as x, y and z co-ordinates Start with a point cloud that has individual LiDAR returns as x, y and z co-ordinates Using an algorithm we filter these points to find “low” points for a given area, these points are classified as ground. Using an algorithm we filter these points to find “low” points for a given area, these points are classified as ground.

24
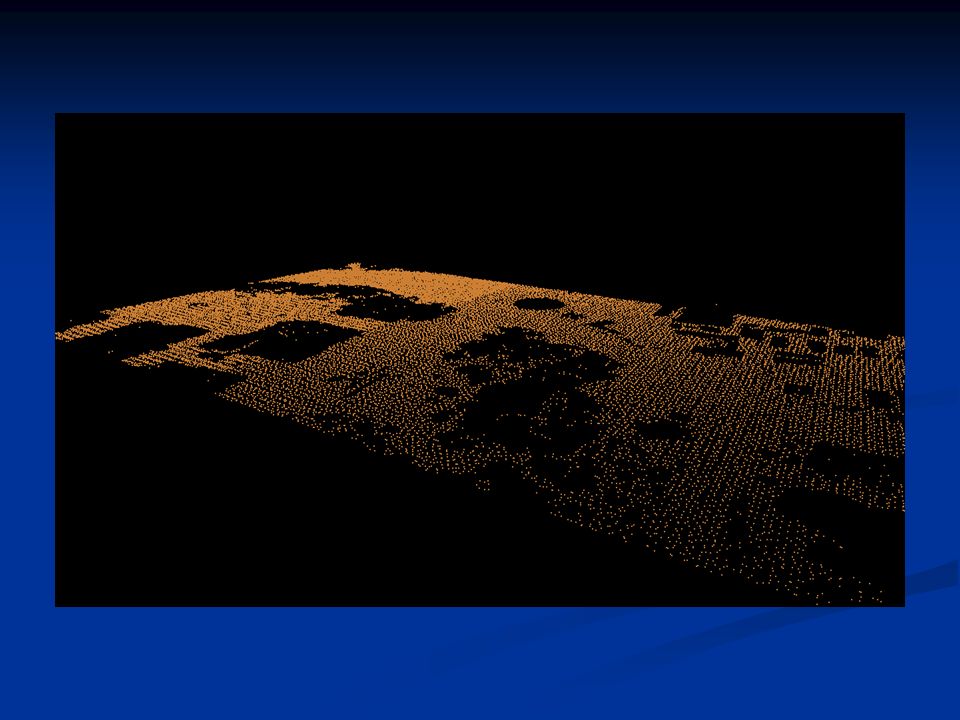
Filtering and Classifying LiDAR returns Start with a point cloud that has individual LiDAR returns as x, y and z co-ordinates Start with a point cloud that has individual LiDAR returns as x, y and z co-ordinates Using an algorithm we filter these points to find “low” points for a given area, these points are classified as ground. Using an algorithm we filter these points to find “low” points for a given area, these points are classified as ground. Other returns are then classified as vegetation or buildings. Heights are then transformed from height from the sensor to the height above ground. Other returns are then classified as vegetation or buildings. Heights are then transformed from height from the sensor to the height above ground.

26
Statistical Parameters of a cell Mean Return Height Maximum Return Height Percentile Heights Percent Cover Kurtosis Skew Standard Deviation

27
Mean Return Height

28
LiDAR to Plot-Level Data

30
Biomass by Land cover type in Burlington and Camden Counties

31
Impact of repeated fires on tree biomass

32
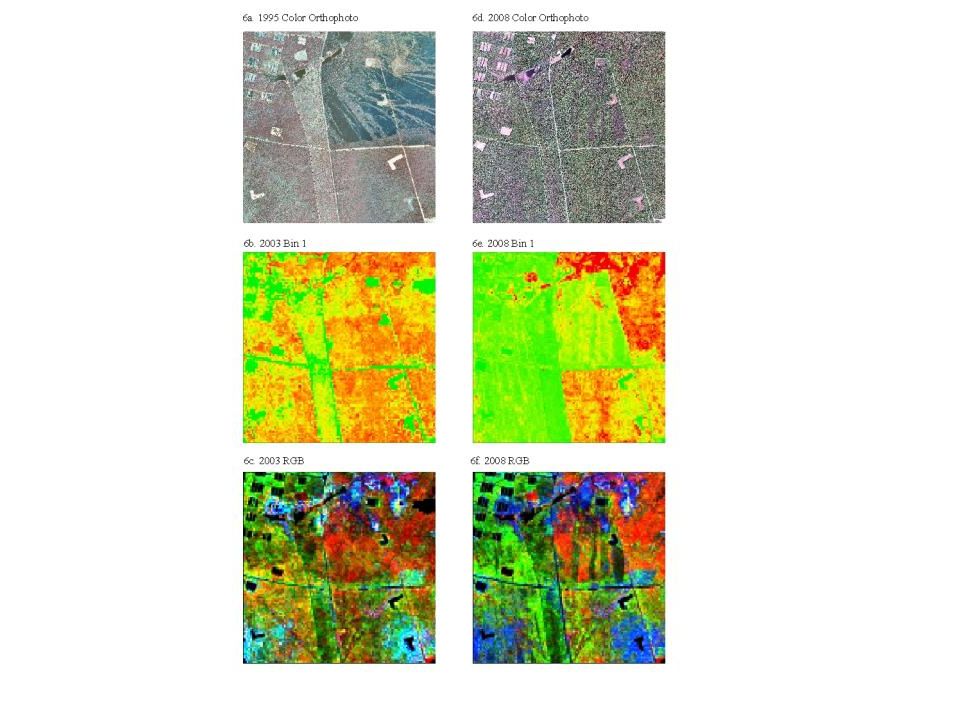
Multi-Temporal Dataset at the Silas Little Experimental Forest Extent 2004 2005

33
Gypsy Moth Defoliation from 2005-2008

34
Foliage Density Profiles

37
Gypsy Moth Defoliation Typical Oak-Pine Young Pine Regeneration Pitch-Pine Lowland Unsupervised Classification of CHPs

38
Canopy Density profiles stratified by Cover type

39
Trajectory of Foliage Density Profile given repeated fires

40
Questions?

Similar presentations


 with height affect LAI estimates? LAI can be calculated.>")


