Download presentation
Presentation is loading. Please wait.

1
David Card, Carlos Dobkin, Nicole Maestas
The impact of nearly universal insurance coverage on health care utilization: evidence from medicare David Card, Carlos Dobkin, Nicole Maestas

2
Background One fifth of non-elderly adults in the United States lacked health insurance coverage in Most of these were from lower-income families, and nearly one-half were African American or Hispanic Many analysts have argued that unequal insurance coverage contributes to disparities in health care utilization and health outcomes across socio-economic groups.

3
Background In contrast to the heterogeneity among the non-elderly, fewer than 1% of the elderly population are uninsured, and most have fee-for-service Medicare coverage Medicare people who are at least 65 and have worked 40 quarters or more in covered employment (or have a spouse who did). Coverage is also available to younger people with severe kidney disease and recipients of Social Security Disability Insurance (DI). Medicare hospital insurance (Part A) free of charge medical insurance (Part B) for a modest monthly premium
. Coverage is also available to younger people with severe kidney disease and recipients of Social Security Disability Insurance (DI). Medicare hospital insurance (Part A) free of charge. medical insurance (Part B) for a modest monthly premium.")
4
Research Question How does the insurance coverage affect the health care use, or even health disparity? This paper exploits the variation of insurance coverage due to Medicare through a regression discontinuity (RD) design on coverage access of care and health use health disparity
 design on. coverage. access of care and health use. health disparity.")
5
Main contributions We examine a wider range of outcomes.
We focus on the differential effects of Medicare eligibility on the health outcomes of different subgroups, and use the pattern of inter-group differences to assess whether these impacts arise through changes in insurance coverage, insurance generosity, or other channels. We also quantify the extent to which the onset of Medicare eligibility reduces or increases disparities in use of different types of services.

6
DATA Data Year:1992-2003/1996~2004/2001/1992~2002 Age: 55 ~75/60~70
National Health Interview Survey (NHIS) March Current Population Survey (CPS) Survey of Income and Program Participation (SIPP) Hospital Discharge Files (California, Florida, and New York) Year: /1996~2004/2001/1992~2002 Age: 55 ~75/60~70 Sample size:160,821/211,927/9,932,593
 March Current Population Survey (CPS) Survey of Income and Program Participation (SIPP) Hospital Discharge Files (California, Florida, and New York) Year: /1996~2004/2001/1992~2002. Age: 55 ~75/60~70. Sample size:160,821/211,927/9,932,593.")
7
Causal Effect of Health Insurance
Problem:insurance coverage is endogenous source of exogenous variation in insurance status. is a measure of health care use for individual i in socioeconomic group j at age a is an unobserved error component is a set of covariates (e.g., gender and region) is a smooth function representing the age profile of outcome y for group j (k=1,2,…,K) are characteristics of the insurance coverage held by the individual [Ex] co-payment rates or the presence of gatekeeper restrictions
 is a smooth function representing the age profile of outcome y for group j. (k=1,2,…,K) are characteristics of the insurance coverage held by the individual. [Ex] co-payment rates or the presence of gatekeeper restrictions.")
8
RDD indicating any coverage, and indicating a relatively generous insurance package (i.e., low co-payments and few gate-keeper restrictions) where and are group-specific coefficients, and are smooth age profiles for group j, and denotes an indicator for being age 65 or older. The age threshold for Medicare eligibility at 65 provides a credible source of exogenous variation in insurance status.

9
Reduced form Combining equations (2a) and (2b) with equation (1)
represents the reduced form age profile for group j discontinuity in y for group j at age 65 error term

10
Effect on coverage Low educated (plus minority) are more likely to have coverage after 65 High education (white) are more likely to buy one more insurance after 65
 are more likely to buy one more insurance after 65.")
13
Low educated (plus minority) are more likely to have coverage after 65
High education (white) are more likely to buy one more insurance after 65
 are more likely to buy one more insurance after 65.")
14
Table 1 shows the effects of reaching age 65 on five insurance-related variables:
the probability of Medicare coverage the probability of any health insurance coverage the probability of private coverage the probability of two or more forms of coverage the probability that an individual’s primary health insurance is a managed care program

19
No confounding factors
No observed change in employment, family structure, family income, and location all trend relatively smoothly at age 65, and are unlikely to confound our analysis of the impact of Medicare eligibility.

26
Effect of Health Care Access and Utilization
Analyze the effects of reaching age 65 on access to care and utilization of health care services. Since 1997 the NHIS has asked two questions: (1) “During the past 12 months has medical care been delayed for this person because of worry about the cost?” (2) “During the past 12 months was there any time when this person needed medical care but did not get it because (this person) could not afford it?”
 During the past 12 months has medical care been delayed for this person because of worry about the cost (2) During the past 12 months was there any time when this person needed medical care but did not get it because (this person) could not afford it")
31
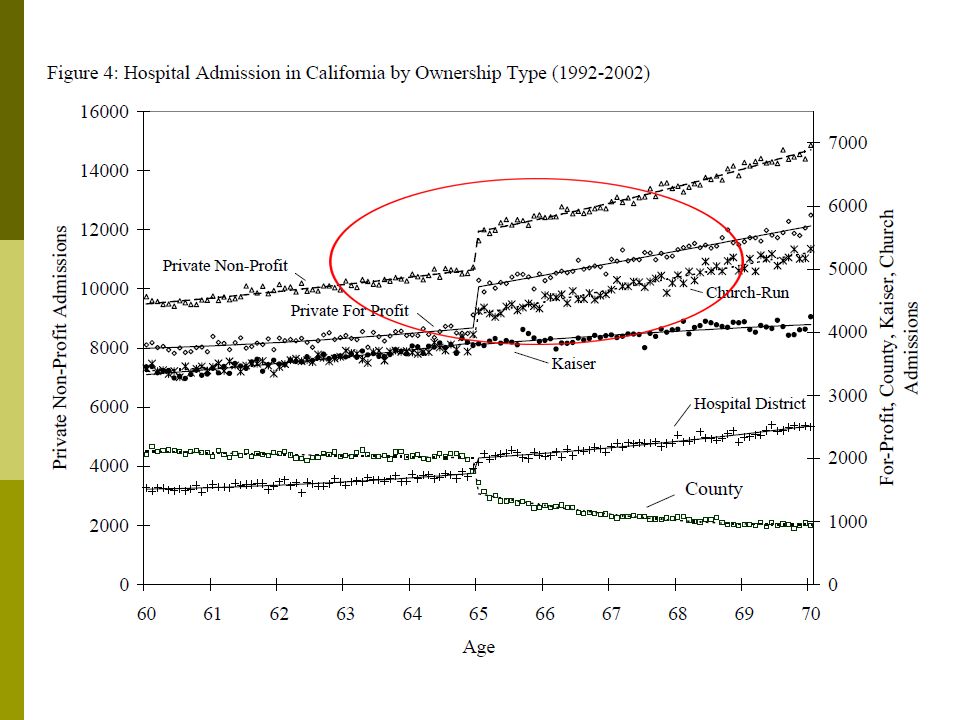
Effect on Hospitalization
We use hospital discharge records from for people between the ages of 60 and 70 in California, Florida, and New York to examine changes in the number and characteristics of hospital admissions at 65. The data exclude hospitals not regulated by the states such as Veteran Administration hospitals. For our analysis, we drop patients that are admitted as transfers from other hospitals or medical facilities.

32
Effect on Hospitalization
For some of our analyses we convert the numbers of hospital admissions into rates, using population estimates derived from Census Bureau data as denominators. The advantage of hospitalization rates : they can be compared across groups to evaluate disparities in the pre-65 population. The disadvantage of hospitalization rates : the denominators must be interpolated from Census Bureau population estimates, introducing some noise in the age profiles of the hospitalization rates.

39
Summary of Patterns across Groups
We use the framework of equation (4) to relate changes in insurance characteristics at 65 to the changes in health related outcomes. is the discontinuity in y for group j at age 65. is the discontinuity in y for group 1 at age 65. is the discontinuity in y for group 2 at age 65. is an error term.
 to relate changes in insurance characteristics at 65 to the changes in health related outcomes. is the discontinuity in y for group j at age 65. is the discontinuity in y for group 1 at age 65. is the discontinuity in y for group 2 at age 65. is an error term.")
Similar presentations


 Sarah Bales Public Policy in Asia,>")

