Download presentation
Presentation is loading. Please wait.

1
12 Ways MAP Data Can Be Used in a School

2
12 Ways To Use MAP Data Monitor Academic Growth Using National Norms Identify Individual Reading Pathway using Lexile Scores Inform Teacher Professional Growth Plans Inform Staff Development Decisions Flexible Grouping for Differentiated Instruction Universal Screening Course Placement Inform Instruction for Individuals or Groups of Students Evaluate Program Success Predict Student Performance on State Tests Predict Student College/Career Readiness Pathway Compare Students Achievement to Stable National Norms

3
Universal Screening What is the Goal of RTI? Success for ALL Children in the Core Curriculum – Tier 1

4
MAP was Designed Pre-RTI Purpose is use for ALL kids Ideal Tier One Assessment Universal Screener Differentiate Instruction within Tier One Currently does not have PM capabilities Universal Screening

5
How Did MAP Rate as a Universal Screener? Screeners should not over-identify or under-identify which kids are at risk This is “classification accuracy” If Area Under the Curve (AUC) ≥.85, measure has excellent classification accuracy MAP’s classification accuracy is consistently above.88 (AUC)
 ≥.85, measure has excellent classification accuracy MAP’s classification accuracy is consistently above.88 (AUC).")
6
Other Third Party Reviews http://www.rti4success.org/

7
RIT scores can be used as indicators for success in curricular areas by understanding what prior knowledge is necessary to be successful. Use DesCartes along with NWEA’s Comparative Data to Inform Instructional Decisions sheet. Course Placement

8
Comparative Data to Inform Instructional Decisions

9
Course Placement Access DesCartes:

10
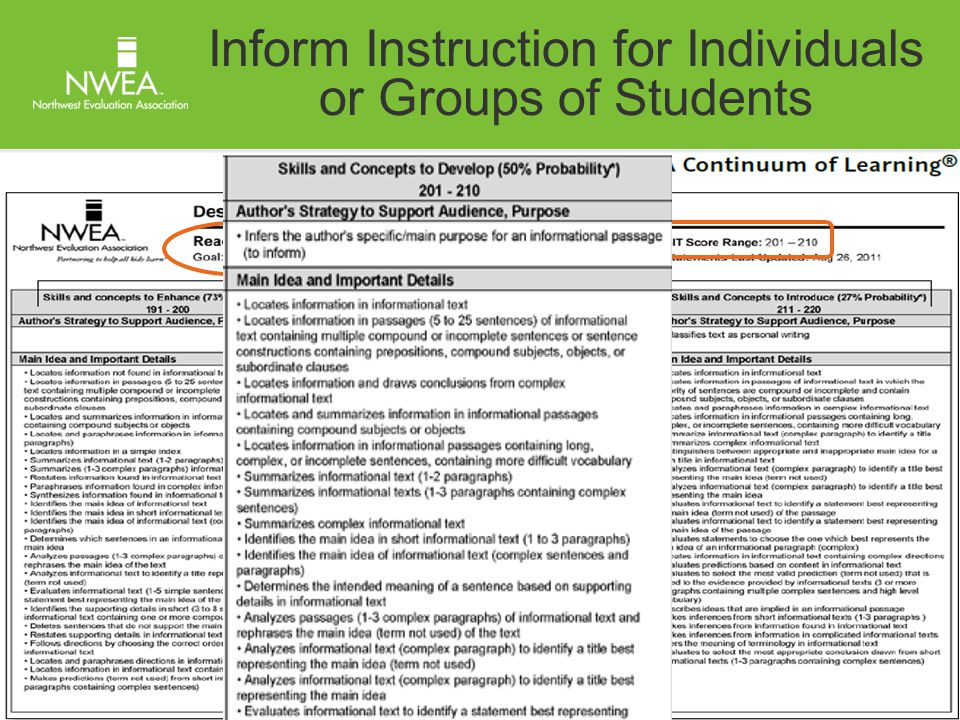
Inform Instruction for Individuals or Groups of Students

13
Evaluate Program Success District Summary Report by Grade District Summary Report by Institution Reports that can be used: How to Access: Client-Server: Must be ordered using Crystal Reports viewer after the testing window has been closed. Web-based: Access on your MARC site after your testing window has been closed.

14
Evaluate Program Success

16
NWEA’s Research Team provides states with linking studies that predict how students will perform on state test using RIT scores as the predictor. States without linking studies use the 40 th percentile for predicting proficiency on the state test. http://www.nwea.org/our-research Predicting Student Performance on State Tests

17
Web-based: Client-Server: Reports Page Data Tools – Dynamic Reporting Suite Projected Proficiency MARC MAP Reports Breakdown Reports

18
Predicting College/Career Readiness Pathways Released in December, 2011 Use MAP RIT scores as a predictor on how students will do on the college readiness benchmarks of the EXPLORE, PLAN, and ACT. The percentile ranks provide an indicator of the difficulty of these benchmarks using NWEA’s 2011 norming study. Provides tables showing the estimated probability of students meeting the designated college readiness benchmarks.

19
Predicting College/Career Readiness Pathways Active NWEA districts that use EXPLORE, PLAN, and ACT ACT data was matched to corresponding MAP data at the individual level No formal sampling strategies employed other than to cut extreme residuals

20
Predicting College/Career Readiness Pathways

22
Student Achievement Compared to National Norms Presently using the 2011 NWEA RIT Scale Norms Study. Usually updated every 3 years but will wait until 2015 until the next Norms Study will be released. Norms include the subjects of Reading, Language Usage, Mathematics, and Science. Allows educators to compare class or grade-level performance to students from a wide variety of schools across the country. The study’s results are based on grade level samples of at least 20,000 students at each grade level, K-11. Rigorous post-stratification procedures where used to be sure the norms are representative of the U.S. school-age population.

23
Student Achievement Compared to National Norms Status Norms: Point in time average RIT scores at each grade level, K-11.

24
Student Achievement Compared to National Norms Growth Norms: Average RIT growth for each RIT score at a grade level.

25
Lexile scores are reported on the Reading Teacher/Class Report, Student Progress Report, and Student Goal-Setting Worksheet. The Lexile score is reported with a 150 point range. The lexile score helps teachers, media center staff, parents, and students select appropriately challenging reading materials. NWEA does not evaluate the quality of text readability and reading leveling systems, so due diligence is urged when selecting reading materials. Using Lexiles to Identify Individual Reading Pathways

27
Dynamic Reports: Lexile Report

28
Using Lexiles to Identify Individual Reading Pathways Dynamic Reports: Student Booklist – Reading Resources

29
Using Lexiles to Identify Individual Reading Pathways

31
Analyze MAP Class/Teacher Report after each testing season by looking at your class summary data. Determine if there is a goal performance area you want or need to focus on. Discuss options with your administrator and fellow teachers. Decide on strategies you will use with your students. Analyze your Achievement Status & Growth Summary Report to determine which students are growing academically as they are projected to grow. Inform Teacher Professional Growth Plans

35
Analyze the following reports: – District Summary Report by Grade and School – District Growth Summary Report by Grade and School – Grade Report Look for strengths and areas of concern along with any trend data that you able to identify. Use that information to decide what types of staff development is needed. Inform Staff Development Decisions

38
Flexible Grouping for Differentiated Instruction

39
Questions? Thank You!

Similar presentations


 Curt Nath Director of Curriculum Ocean City School District.>")


>")

 UPDATE October 29, 2013.>")


 OVERVIEW.>")
 Overview Northern Tier Schools October 26, 2011 Carol Jessen and JaLena Slack>")