Download presentation
Presentation is loading. Please wait.

1
Laurent Brochard NIV in the ICU: Lessons learnt in the last 20 years

3
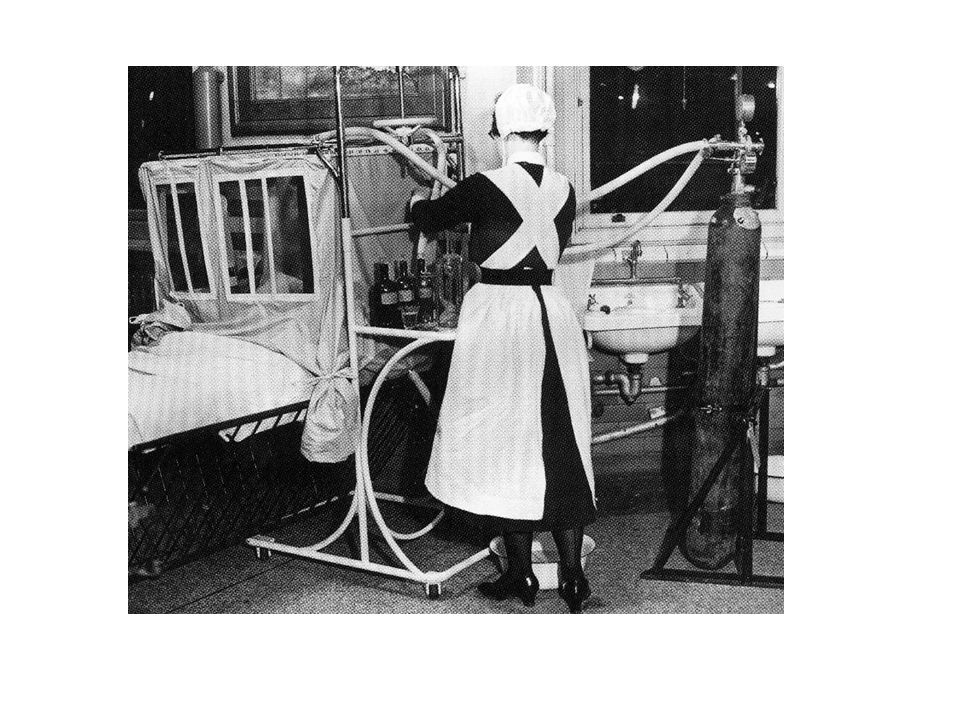
The Engström ventilator (1951) Ventilatory problems in thoracic anesthesia; VO Björk, CG Engström et al J Thoracic Surg. 1956; 31:117

4
Sadoul, Bull.physio-pathol.Resp. 1965

5
Traitement par ventilation instrumentale de 100 cas d'insuffisance respiratoire aigue severe (pACO2> 70) chez des pulmonaires chroniques Sadoul, Bull.physio-pathol.Resp. 1965 NIV and 2y mortality

6
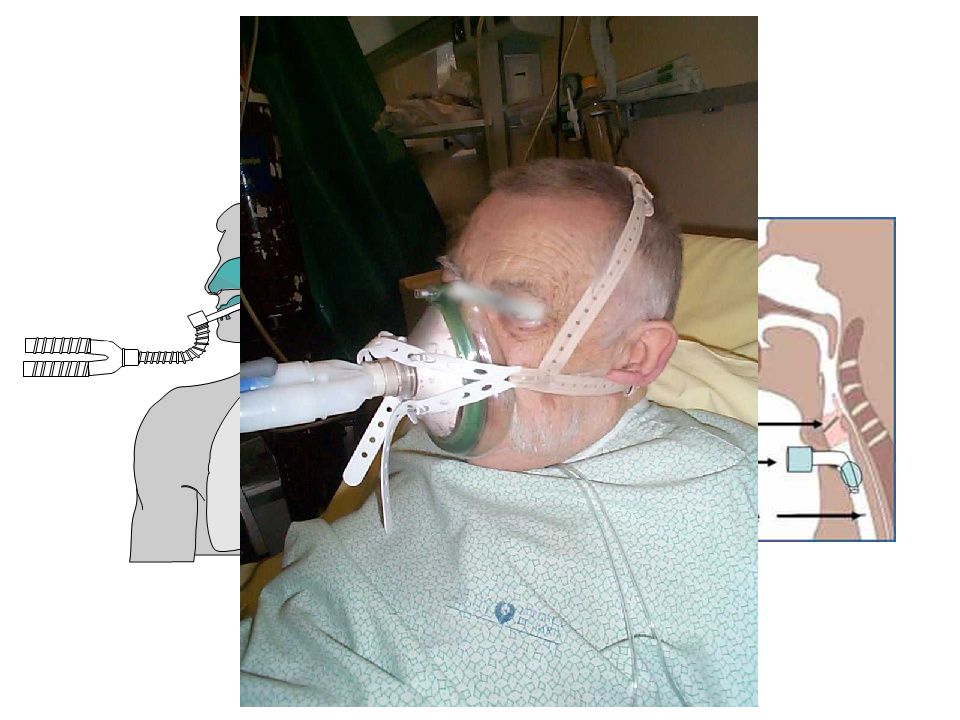
Mask ventilation difficult Need for respiratory stimulant Tracheal ventilation considered much easier 1960. Pr A.B. Tonnel

7
Chest 1990 Chest 1994

8
Brochard L ARRD 1987

9
Brochard L et al. ARRD 1989; 139:513-521

13
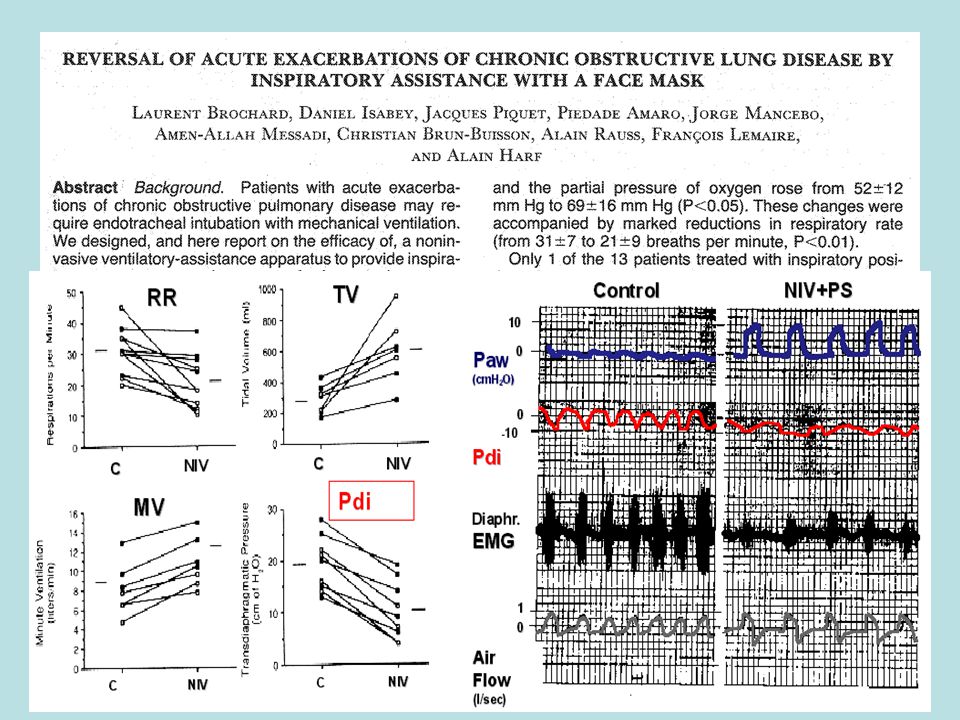
NIV and exacerbations of COPD Effects on arterial blood gases Brochard et al NEJM 1990, 323, 1523

15
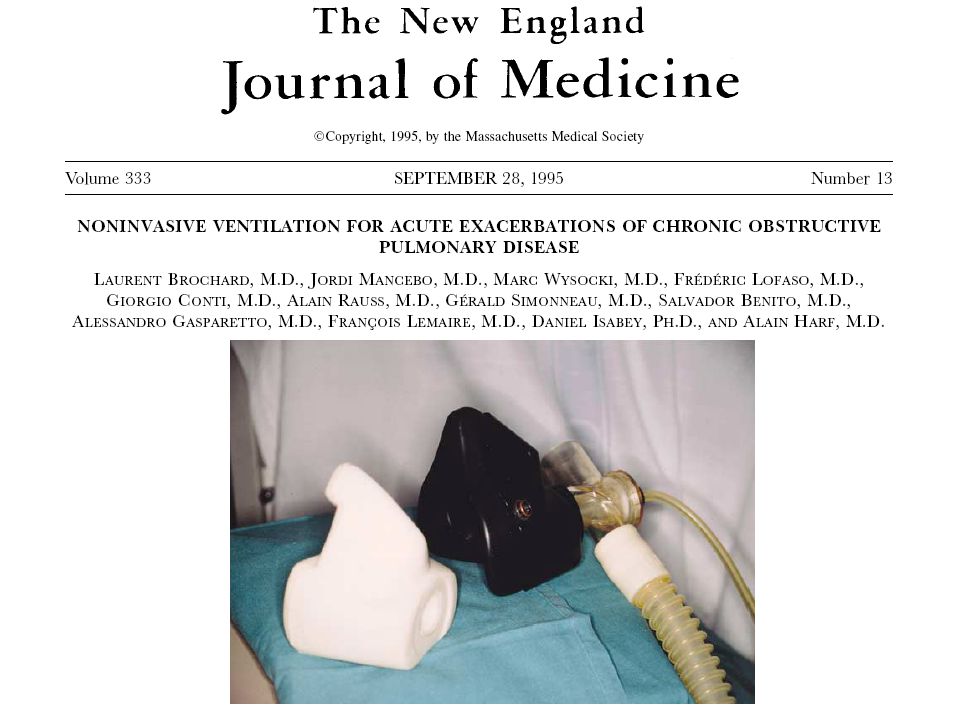
Brochard et al. 1995 NIV and exacerbations of COPD

16
Intubation Hosp Stay Mortality NIV - PS 20 ( n=43 ) 26 % 23 ± 17 j 9 % O 2 ( n=42 ) 74 % 35 ± 33 j 29 % NIV and exacerbations of COPD Brochard et al NEJM 1995; 333, 817-22
 26 % 23 ± 17 j 9 % O 2 ( n=42 ) 74 % 35 ± 33 j 29 % NIV and exacerbations of COPD Brochard et al NEJM 1995; 333,")
17
Respiratory Rate Endotracheal Intubation Mortality Rate

19
CPAP vs BIPAP in CPE: Overall

20
No sedation No central line No urinary catheter No endotracheal tube

21
NIV & Nosocomial infections p<0.0001 p=0.02 p<0.001 Girou et al. JAMA 2000

22
Ferrer et al. AJRCCM 2003; 168: 1438 n = 51 n = 54

23
CCM 2007

25
NIV in hypoxemic or hypercapnic patients: Is there a different impact?

26
Demoule A et al ICM 2006 Mortality

27
Reintubation 48% Postextubation ARF Reintubation 72%

28
Reintubation 8% Reintubation 11% Prevention of postextubation ARF

29
2004 Incidence study 353 ICU 26 countries Esteban et al, AJRCCM 2008 1998 Incidence study 361 ICU 20 countries Esteban et al, JAMA 2002 2010 Incidence study 553 ICU 39 countries Esteban et al Use of Mechanical ventilation

30
1 st, 2 d, 3 rd International Studies of Mechanical Ventilation Countries 37 ICUs 1,267 Patients 18,321

31
199820042010 n = 5183 n = 4986 n = 8313 Age, mean (SD) Age, mean (SD) 59 (17) 59 /17 61/17 Gender, female (%) Gender, female (%) 39 % 40 % 38 % SAPS II, mean (SD) SAPS II, mean (SD) 44 (17) 42 (18) 45 (18) BMI. mean (SD) BMI. mean (SD) 27 (6) Baseline Demographics
 BMI. mean (SD) 27 (6) Baseline Demographics.")
32
NIV as first attempt

33
Use of NIV 1998 - 2010

34
SRLF - 2012 Results of the 3 rd NIV incidence study (France and Belgium) A Demoule, S Jaber, A Kouatchet, J Lambert, F Meziani, S Perbet, L Camous, R Janssen-Langenstein, M Alves, B Zuber, F Collet, J Messika, X Favre, O Guisset, B Misset, A Lafabrie, L Brochard, E Azoulay For the oVNI group
 A Demoule, S Jaber, A Kouatchet, J Lambert, F Meziani, S Perbet, L Camous, R Janssen-Langenstein, M Alves, B Zuber, F Collet, J Messika, X Favre, O Guisset, B Misset, A Lafabrie, L Brochard, E Azoulay For the oVNI group")
35
Methods Prospective longitudinal study 54 ICUs 2 months (Nov 2010- April 2011) 2653 patients included 2445 invasive ventilatory assistance or NIV Survey 2010 - 2011
 2653 patients included 2445 invasive ventilatory assistance or NIV Survey")
36
Results 1 Incidence NIV 23 vs.31% - pre 23% - post-extub 8% * *

37
* $ Results 2 Indications CPE: 53 vs.37% - « de novo » : 16 vs. 22% * *

38
Results 3 success overall success rate : 68 vs. 56% $

39
Summary The global NIV rate is stable –Increase for post-extubation Variations across indications –Increase for CPE –Stable in exacerbations of CRF –Decrease in « de novo » ARF Success rate is increasing Compared to 2002

40
Crit Care Med 2007;35:932–939

41
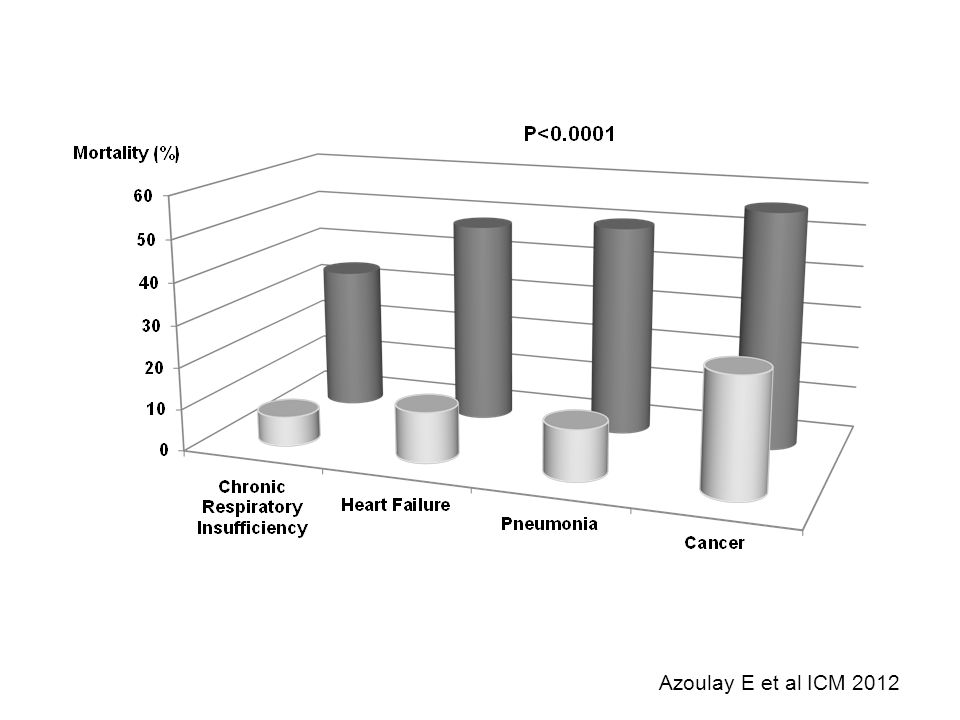
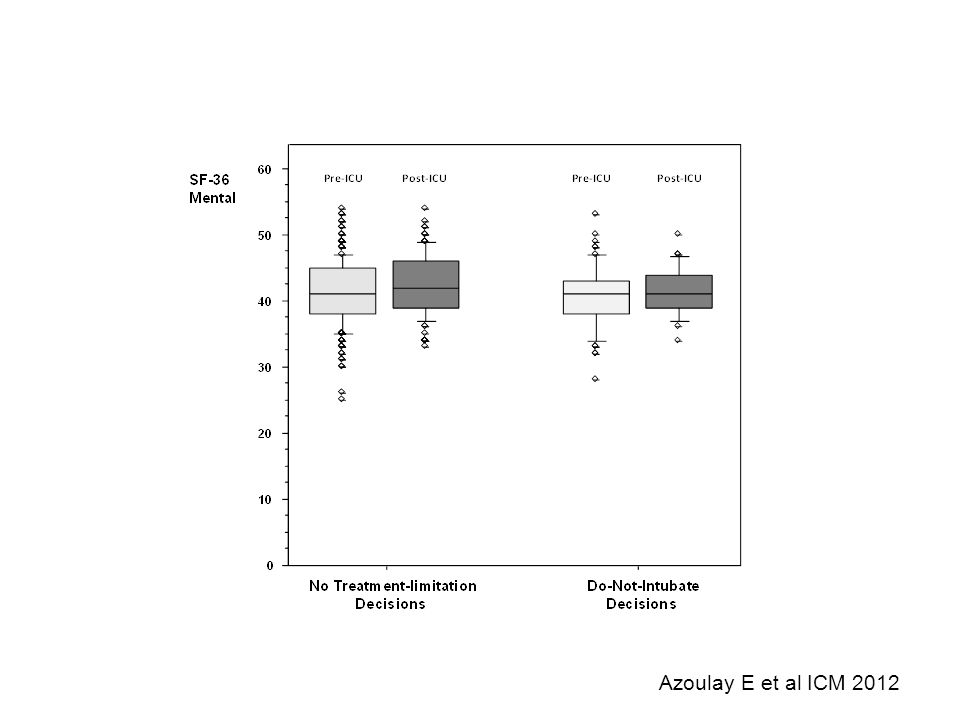
Azoulay E et al ICM 2012

45
Patients Azoulay E et al ICM 2012

46
Relatives Azoulay E et al ICM 2012

47
Non invasive ventilation for acute respiratory failure Reduces the complications associated with mechanical ventilation Improves the outcome of COPD exacerbations and cardiogenic pulmonary edema A careful use in hypoxemic respiratory failure may be interesting NIV represents an interesting therapy when intensity of therapy is limited

48
Merci! Thank you! Blog http://mechanicalventilation.wordpress.com

49
199820042010 NIV rate (%) NIV rate (%)4.4(0.001)8.714.6% SAPS II SAPS II 39.5 (16) 39.0 (15) 38.5 (15) Failure (intubation) (%) Failure (intubation) (%)31(0.39) 37 % 30.5% Mortality in NIV failure Mortality in NIV failure47%(0.94)48%49% Mortality in NIV success Mortality in NIV success21%(0.36)15% 9 % Non-Invasive Ventilation NIV POSTEXTUBATION NIV POSTEXTUBATION 11.1 % FOR PREVENTION 5.9 % FOR TREATMENT FOR TREATMENT 5.2 %
 NIV rate (%)4.4(0.001) % SAPS II SAPS II 39.5 (16) 39.0 (15) 38.5 (15) Failure (intubation) (%) Failure (intubation) (%)31(0.39) 37 % 30.5% Mortality in NIV failure Mortality in NIV failure47%(0.94)48%49% Mortality in NIV success Mortality in NIV success21%(0.36)15% 9 % Non-Invasive Ventilation NIV POSTEXTUBATION NIV POSTEXTUBATION 11.1 % FOR PREVENTION 5.9 % FOR TREATMENT FOR TREATMENT 5.2 %")
50
199820042010 n = 5183 n = 4986 n = 8576 Main Reason for M.V: Main Reason for M.V: COPD 10 % 5 % 6 % Asthma 1 % Coma 17 % 19 % Neuromuscular disease 2 % 1 % ARF 68.5 % ARDS 4.5 % 5 % 3 % Postoperative 21 % CHF 10 % 6 % 8 % Pneumonia 14 % 11 % 10 % Sepsis 9 % Trauma 8 % 6% 4.5 % COPD 10 %5 %6 % ARDS4.5 %5 %3 %

51
Oxygen (15) CPAP (15) P/F 169 (71-240) 167 (76-270) RR 30 (18-44) 2 (20-60) BAL(ml) 66 15 43 19 p<0.03 ETI 4 0 p<0.03 NIV 1 0
 CPAP (15) P/F 169 (71-240) 167 (76-270) RR 30 (18-44) 2 (20-60) BAL(ml) 66 19 p<0.03 ETI 4 0 p<0.03 NIV 1 0")
52
CCM 2009

53
Rouzé A et al Mémoire M2 Univ Paris Est

54
Secular Trends in Mortality and Use of NIV in COPD and Severe CPE P<0.0001 P=0.012 Girou et al. JAMA 2003

Similar presentations


>")


