Download presentation
Presentation is loading. Please wait.

2
Population and Migration Seeking your views Welcome and introductions Centre for Demography

3
Population and Migration Welcome and Introduction ONS Centre for Demography Centre for Demography

4
Aims of the day Communicate the latest work being carried out to improve population statistics through –the 2011 Census and –the Improving Migration and Population Statistics programme Census –progress on planning and executing the 2011 Census –methodology for assessing coverage –quality assurance of the census population estimates Improving Migration and Population Statistics –present the indicative impacts –explain user engagement process –provide chance to feedback on results

5
AGENDA am 9.30 - 10.00 Registration and coffee 10.00Welcome and introduction to the day 10.15Census overview –This session will provide an overview of the census components that are key to producing Census population estimates –To provide an update on progress on recent events, such as the census rehearsal. 10.45Census coverage –This will cover the methodology being developed to assess census coverage –It will focus on improvements that address many of the lessons from 2001 11.15 – 11.30 Coffee break 11.30Census data quality assurance –To provide an update on Census data quality assurance plans –To summarise the processes and evidence to be used to validate Census local authority estimates 12.00Questions 12.30 – 1.15 Lunch

6
Agenda pm 12.30 – 1.15 Lunch 1.15 Improving Migration and Population Statistics Session I –Introduction and Background –User engagement –Indicative Impacts 2.30 – 2.45 Tea Break 2.45 Improving Migration and Population Statistics Session II –Open discussion 4:00 Close

7
High level timetable 18 January 2010 –Final date for comments 27 May 2010 –Revised 2002-08 population estimate for LAs –2008-based Subnational Population Projections 27 March 2011 –Census day

8
Domestics Fire Exits Fire Alarm Refreshments Tea and Coffee about 11:15 Lunch at about 12:30 Tea and Coffee about 2:30 Close at about 4:00 Toilets Delegate Packs Questions

9
2011 Census Overview Garnett Compton ONS Demography Seminar - December 2009

10
Introduction Reminder – key design changes Where are we now? Census rehearsal Census address register Census legislation Census stakeholder engagement Census outputs Key milestones

11
What’s new since 2001? Questions New Qs on population characteristics New Qs on population base Address register Field operation Distribution via post Distribution of field staff Questionnaire tracking Internet data capture

12
Census rehearsal areas Rehearsal areas: Lancaster – 62,000 Newham – London – 40,000 Isle of Anglesey – Wales 34,000 Small scale test: Birmingham – 17,000 Objective : To validate 2011 Census field procedures and supporting systems

13
Rehearsal systems/procedures Recruitment of field staff E-learning Flexible deployment of field staff Questionnaire Tracking Publicity Local Authority & Community engagement Census coverage survey

14
Rehearsal systems/procedures Address register Printing Royal Mail delivery & collection Internet completion Public contact centre Online help systems Census Management Information System ‘best internet survey I’ve ever seen’ – Prof Phil Rees

15
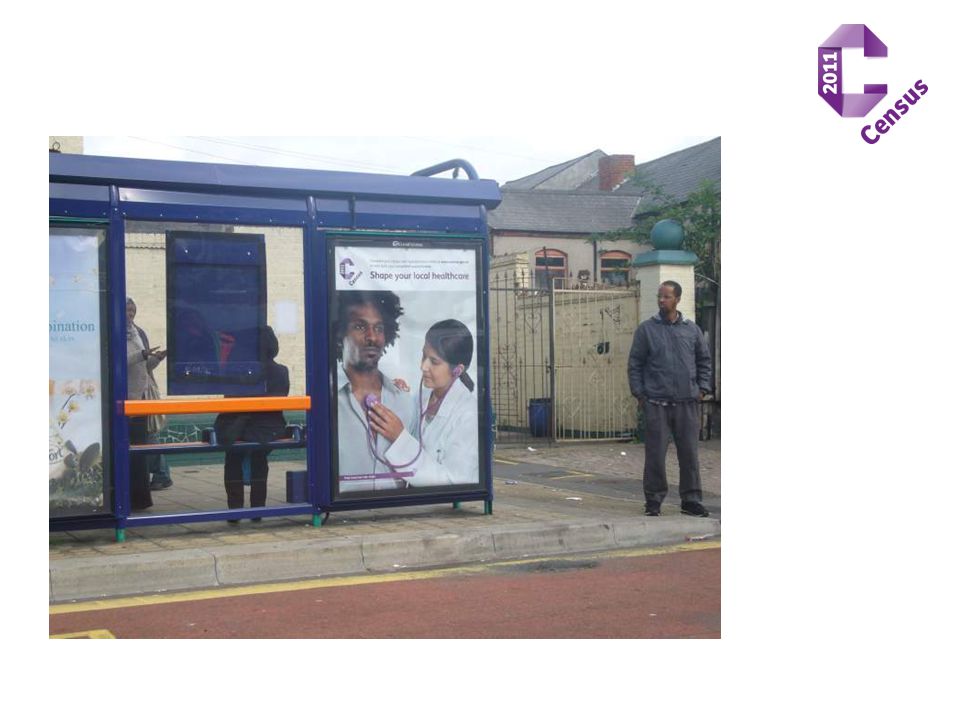
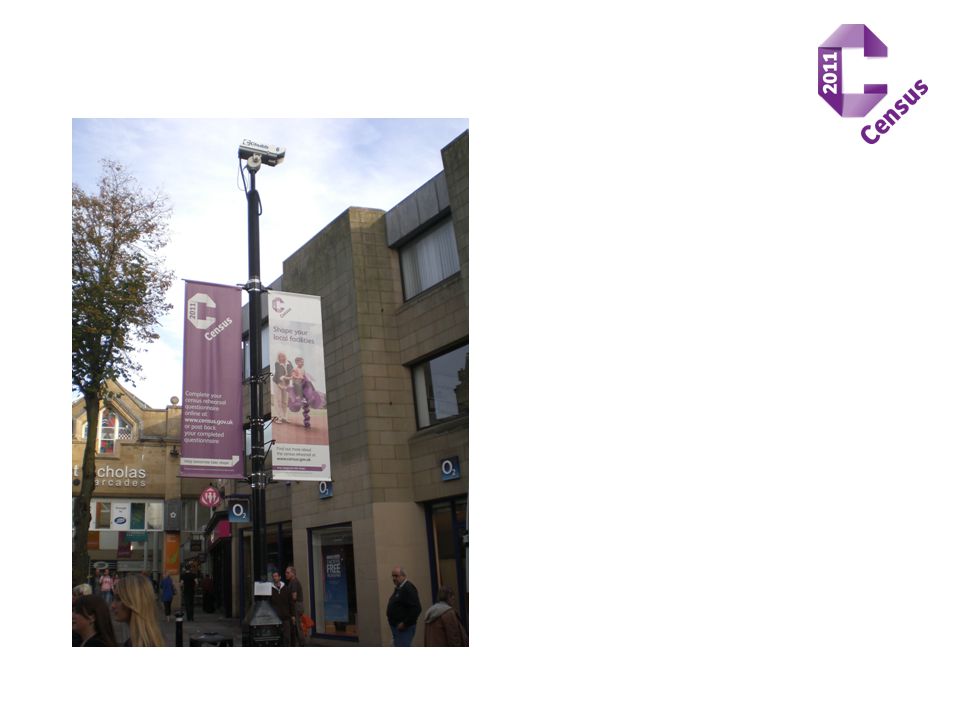
Rehearsal publicity

19
Engaging Advertising Reaching students and young people where they spent their time with some engaging advertising

20
Total Returns by Completion Method (up to 29 November) (provisional)
 (provisional)")
21
REHEARSAL RESPONSE 35% overall (so far – 29/11) Action taken to improve response More staff in Newham More community liaison More advertising Targeted letters/questionnaires Possible reasons – logistical postal delays (stuck in system?)? time of year? contact patterns? Possible reasons – behaviour lack of trust? not important – voluntary? lack of awareness? 21/10 29/11 Anglesey 34% 42% Lancaster 30% 39% Newham 10% 21% Overall 25% 35% Birmingham 11% 21%

22
Rehearsal – some early thoughts (1) What worked well: Recruitment, pay and training Daily receipting Questionnaire tracking system Linking replacements/deactivating addresses Generating follow-up lists Internet data collection/Web self help Actions to improve response rates
 What worked well: Recruitment, pay and training Daily receipting Questionnaire tracking system Linking replacements/deactivating addresses Generating follow-up lists Internet data collection/Web self help Actions to improve response rates")
23
Rehearsal – some early thoughts (2) What needs reviewing and refining: Understanding low response rates Targeting of initial field resource Mixture of full and part-time hours Training and doorstep messages Management information Specification of reports Improve awareness and routing to IDC Working with LAs to increase publicity
 What needs reviewing and refining: Understanding low response rates Targeting of initial field resource Mixture of full and part-time hours Training and doorstep messages Management information Specification of reports Improve awareness and routing to IDC Working with LAs to increase publicity")
24
Where are we now

25
Address register Data sent to suppliers for resolution (Royal Mail, Intelligent Addressing) Unmatched addresses sent to LAs Address check implementation started In the field May – Aug 2010 15% of postcodes targeted on mismatches and multi- occupation Strong focus now on communal establishments Prioritised for target populations – 3 rd party suppliers Special address check staff covering all of E&W
 Unmatched addresses sent to LAs Address check implementation started In the field May – Aug % of postcodes targeted on mismatches and multi- occupation Strong focus now on communal establishments Prioritised for target populations – 3 rd party suppliers Special address check staff covering all of E&W")
26
Number of mismatched addresses sent to LAs for resolution

27
Census legislation White Paper - 11 December 2008 Census Order – tabled 21 October 2009 Debated by the Delegated Legislation Committee - 30 November Full Lords debate – 2 December Privy Council - likely 10 Feb Census Regulations – March 2010 EU legislation

28
LA engagement - foundations Stakeholder website launched September New LA engagement advisory groups initiated Operational advisory group Communication advisory group Local authority partnership guide launched October Local authority communication toolkit Regional networks established by many census regional champions Online communities of practice

29
What’s next for LAs? Second round of regional meetings hosted by CRCs Regional meetings for LA communication teams to launch toolkit and councillor handbook Defining the ways of working during the operational phase Local partnership plans to agree commitments by each party around –Media relations and publicity –Community liaison –Support with logistics –Ongoing contact mechanisms

30
Community liaison Liaison with national organisations representing target population groups continues Some good offers of help and support Communication materials for community groups to use being developed for March 2010 40 Community advisors start September 2010 to liaise with black and ethnic minority target population groups Partnership plan with LA will also cover community liaison activities

31
Census outputs - vision Web as the primary dissemination route Flexibility for end users to create own products Bulk download of data via the web Web functionality provided jointly with external partners 2001 comparisons which exploit stable geography (OAs) Microdata products provided via secure mechanisms UK Wide Approach with common disclosure control
 Microdata products provided via secure mechanisms UK Wide Approach with common disclosure control")
32
Outputs – next steps Continue technical development Demonstrate Prototype & agree partnership proposals Spring 2010 Populate 2011 System with some 2001 data December 2010 User Consultation Round Main content consultation in Dec 2009 Geography consultation in Dec 2009 Publish Proposed 2011 Outputs Product set end- 2010 Disclosure Control UKSDC approach agreed September 2009 Complete alignment of Disclosure Control/Technical constraints and User requirements Summer 2010 Finalise proposals for Microdata delivery Analytical Uses

33
Census – milestones

34
Finally …… Coverage adjustment Quality assurance Quality census relies on other key aspects: Address register Census Operations: –Questionnaire tracking –Publicity –Recruitment –Field operations and procedures

35
Thank you Questions?

37
AGENDA – Census Coverage 1.Background 2.Coverage in the 2001 Census 3.2011 Methodology overview 4.Key changes 5.Summary

38
WHAT IS THE PROBLEM? Despite best efforts, census won’t count every household or person It will also count some people twice Users need robust census estimates - counts not enough In 2001: –One Number Census (ONC) methodology was developed to measure undercount –estimated 1.5 million households missed –3 million persons missed (most from the missing households but some from counted households) –Subsequent studies estimated a further 0.3 million missed In 2011 we want to build on the ONC, as broadly it was successful
 methodology was developed to measure undercount –estimated 1.5 million households missed –3 million persons missed (most from the missing households but some from counted households) –Subsequent studies estimated a further 0.3 million missed In 2011 we want to build on the ONC, as broadly it was successful.")
39
2001 CENSUS UNDERCOUNT BY AGE-SEX

40
RESPONSE RATES BY LOCAL AUTHORITY

41
COVERAGE ASSESSMENT PROCESS OVERVIEW Estimation Matching Adjustment 2011 Census Quality Assurance Census Coverage Survey

42
AREAS OF IMPROVEMENT Elements of CCS Design Estimation methodology Measuring overcount Adjustments for bias in DSE Imputation Motivated by: –lessons learnt from 2001 –2011 Census design e.g. use of internet

43
THE CCS DESIGN Similar to 2001 CCS: –300,000 Households –Sample of small areas (postcodes) –6 weeks after Census Day –Fieldwork almost identical Improvements: –Designed at LA level, not for LA groups –Refined Hard to Count index (5 levels) using up to date data sources –Use Output Areas as PSUs –Select 3 postcodes per OA –Revised allocation of sample (using 2001 patterns)
 –6 weeks after Census Day –Fieldwork almost identical Improvements: –Designed at LA level, not for LA groups –Refined Hard to Count index (5 levels) using up to date data sources –Use Output Areas as PSUs –Select 3 postcodes per OA –Revised allocation of sample (using 2001 patterns)")
44
THE CCS DESIGN (2) What does this mean? –Each LA will have its own sample – at least 1 OA for each hard to count level –Sample is more skewed to LAs with ‘hardest to count’ populations (with an upper limit of 60 OAs) More LAs will have estimates based on their own data Especially in London and for big cities –HtC index will be ‘up to date’ –Most LAs will have 3 HtC levels Most London areas only had one in 2001 Will be a 40%, 40%, 10%, 8%, 2% distribution
 More LAs will have estimates based on their own data Especially in London and for big cities –HtC index will be ‘up to date’ –Most LAs will have 3 HtC levels Most London areas only had one in 2001 Will be a 40%, 40%, 10%, 8%, 2% distribution.")
45
MATCHING AND ESTIMATION Estimation based on Dual System Estimation Used mainly for wildlife applications Requires two ‘counts’ of the population Requires the two counts to be matched Use standard survey estimation techniques to generalise the DSEs to the whole population Ratio estimator Trout, Catfish & Roach provides a fishing example of the principles of the method – Available in delegate packs

46
ESTIMATION Obtained lots of data from 2001 to be able to explore whether improvements can be made One issue was at what level to estimate undercount to best fulfil the assumptions of the methodology (Postcode, Groups of Postcodes) One key issue was whether we should group LAs by geography or by ‘type’ Improvements: Confirmed that using DSE at OA level is sensible Confirmed that we should group LAs by geography Use simple Ratio estimator Confirmed that 2001 LA estimation method is still best
 One key issue was whether we should group LAs by geography or by ‘type’ Improvements: Confirmed that using DSE at OA level is sensible Confirmed that we should group LAs by geography Use simple Ratio estimator Confirmed that 2001 LA estimation method is still best")
47
ESTIMATION (2) What does this mean? –The estimation methodology is much the same as it was –Should be slightly easier to explain –We will group LAs that don’t have enough sample with their neighbours until that group has enough sample –More LAs will have enough sample to produce direct estimates

48
OVERCOUNT In 2001, estimated around 0.4% overcount (duplication) –No adjustments made –Not integrated into methodology For 2011, expecting overcount to be higher –More complex population –Use of internet in 2011 Census Strategy is to: –A) Build a process to identify and remove obvious cases (multiple response resolution) –B) measure and make net adjustments on the remainder –i.e. for the latter we are NOT removing duplicates

49
OVERCOUNT (2) Methodology: –Select targeted samples of census records Second residences Students Children –Very large sample (~600,000k records) –Automatic matching algorithm to identify duplicates –Clerical checking of matches expect to see ~13,000 duplicates Also use the LS to QA the estimates –Estimation of duplication rates by GOR and characteristics estimating which is the correct record –Why not do whole database and remove them? High risk of making false positives and thus removing too many!

50
OVERCOUNT (3) What does this mean? –Population estimates will be reduced where there is overcount –We will be able to say how much adjustment was made due to overcount –The duplicates will still be in the data, we just won’t impute as much for undercount

51
DSE BIAS ADJUSTMENTS Assumptions underpinning DSE: –Homogeneity –Independence –Accurate Matching –Closure DSEs usually have some bias, mostly due to failure of homogeneity assumption In 2001 Census we made a ‘dependence’ adjustment This showed that we need to have a strategy for measuring this

52
DSE BIAS ADJUSTMENTS (2) Mitigate as much as possible: i.Post-stratify DSE so heterogeneity is minimised ii.Independence in CCS field processes iii.Design Matching to get accuracy iv.Collect CCS on same basis as Census Measure remaining bias –Specific adjustments – e.g. Movers, Overcount –Residual biases global adjustment Improved adjustment using Census address register Looking at improving age-sex distribution

53
DSE BIAS ADJUSTMENTS (3) What does this mean? –We will be making adjustments to the estimates based on plausible external data e.g. Household counts Sex ratios –This will be part of the methodology –Also can be used if QA determines estimates are implausible –Haven’t ruled out triple system estimation

54
COVERAGE ADJUSTMENT Imputation methodology had problems converging –Sometimes resulted in poor quality results Improvements: –Model characteristics at higher geographies –Allows more details to be modelled –Some additional topics in the CCS included in models: Migration variable (internal, international) Country of birth (UK and non-UK) –Non-controlled variables imputed by CANCEIS What does this mean? –Better Imputation quality –Characteristics of imputed improved

55
SUMMARY Coverage assessment is an integral part of the 2011 Census It will again define the key census outputs (estimates at LA level by age and sex) and adjust the database We learnt a lot of lessons in 2001 and have been working to address them
 and adjust the database We learnt a lot of lessons in 2001 and have been working to address them")
56
Questions? owen.abbott@ons.gov.uk alan.taylor@ons.gov.uk

57
ESTIMATION results

58
Other results Table 3 – Overall results comparison for the South East Region EA TypeRelative biasRRMSE 95% Confidence Interval widthCensus Coverage Contig0.16%0.33%4841893.4% Noncontig0.07%0.31%4612893.4% Table 7 – Overall results comparison for the North East Region EA TypeRelative biasRRMSE 95% Confidence Interval widthCensus Coverage Contig-0.01%0.46%2217794.4% Noncontig0.06%0.48%2331494.4% Alternative non- contiguous0.01%0.46%2211094.4%

59
Lessons learnt - One Number Census Not designed to be the lifeboat for a poor census Not robust enough to cope with extreme Census failures (Westminster) Not robust enough to cope with extreme changes in areas on the ground (Manchester) Correlation bias is a problem Overcount measurement was not adequate
 Not robust enough to cope with extreme changes in areas on the ground (Manchester) Correlation bias is a problem Overcount measurement was not adequate")
60
2011 Aims and Objectives Measure undercount Measure overcount Address lessons from 2001 Take into account changes -In census design -In those at risk of undercount Accuracy to be as good or better than in 2001 -0.2 per cent confidence interval nationally -2 per cent on half million population total

62
2011 Census data QA: An update on planning and proposals for the validation of LA estimates Louisa Blackwell Paula Guy Glen Doubleday 2011 Census & ONSCD Seminar on Population and Migration December 2009

63
Contents Census data QA objectives Overview of the data QA: topic and demographic QA The QA Panel and its role The process for assessing and approving Census LA estimates; evidence and data Options for adjusting Census population estimates The LA consultation pilot Supporting analysis from 2009 to 2011

64
Census data QA objectives Ensure 2011 Census outputs are fit for purpose and meet user expectations Understand differences between Census population estimates and rolled-forward mid year estimates Ensure Census population characteristics are accurate Transparency Work in partnership with stakeholders Metadata including quality measures published with data

65
Topic QA To quality assure detailed level Census data to address errors such as respondent or enumerator error or those introduced by processes such as data capture, edit or imputation. Includes item-level data, low level geographies and multivariate analysis of specified population subgroups.

66
Demographic QA To quality assure national, regional and Local Authority District census estimates, drawing on external sources, using demographic indicators and guided by the input and direction of an expert QA panel

67
Demographic and Topic QA Data load Apply derivations & filters Item imputation Coverage estimation Coverage imputation Post-adjustment imputation Apply complex DVs Assign output geographies Disclosure control adjustment Demographic QATopic QA Data flows: Questionnaire tracking, Address Register, Field reports, Administrative and Survey sources Reconcile multiple responses within a HH Scanning & recognition Internet data capture

68
The QA Panel and its role Role: To assess Census population estimates at LA / regional / national levels and recommend acceptance / rejection or further research Membership –Head of the ONS Census Design Authority (Chair) –Head of Census Quality Team –Methodology Division experts in coverage adjustment –ONS Centre for Demography experts in mid-year population estimation and projection –Independent expert demographers –Other relevant parties, such as representatives of the LGA, NISRA, GROS, WAG and non-UK member(s)
 –Head of Census Quality Team –Methodology Division experts in coverage adjustment –ONS Centre for Demography experts in mid-year population estimation and projection –Independent expert demographers –Other relevant parties, such as representatives of the LGA, NISRA, GROS, WAG and non-UK member(s)")
69
The QA Panel indicative timetable Key datesMeetings / Activities July 2010 - July 2011Quarterly to agree terms of reference, methods and data July 2011 - Feb 2012Weekly to agree LA estimates Feb - March 2012Overcount, visitor, second residence reconciliation agreed March - May 2012Final LA, regional and national estimates approved

70
Local Authority checking process - overview Level 1 Basic set of checks that all LAs go through Level 2 Additional suite of checks tailored to address particular data problems in LAs that didn’t pass level 1 Level 3 Final checks, following any adjustments/ contingency action and following post-coverage adjustment item imputation National / local reconciliation Cumulative checks above LA level and other geographies

71
LA estimate Level 1 checks QA Panel reviews LA estimates along with national and local reconciliation LOCAL AUTHORITY ESTIMATES QA PROCESS

72
Level 1 checks (against comparators) Demographic indicators: Age / sex distributions, sex ratios, young and old dependency ratios, fertility and mortality measures Key estimates and distributions: Households (vs. Address Register and Council Tax), household size, ethnicity, students, internal and international migrants, armed forces Local evidence: Supplied by LAs and available via other sources Qualitative/ quantitative evidence: Census data processing diagnostics, Management Information and LA profile information
, household size, ethnicity, students, internal and international migrants, armed forces Local evidence: Supplied by LAs and available via other sources Qualitative/ quantitative evidence: Census data processing diagnostics, Management Information and LA profile information.")
73
LA sex ratios compared to England

74
National / local reconciliation Demographic indicators: Internal, home country and international migration flows and patterns Sex ratios, mortality and fertility rates Data checks: Cumulative counts Multiple enumeration rates and reconciliations (eg visitors / usual residents) Population sub-group cumulative totals Pause and review to check progress: After approximately 20 per cent of LAs have been processed
 Population sub-group cumulative totals Pause and review to check progress: After approximately 20 per cent of LAs have been processed")
75
Implement adjustment options LA estimate Level 1 checks QA Panel reviews LA estimates along with national and local reconciliation Level 2 checks QA Panel Rejects QA Panel Accepts Proceed to imputation LOCAL AUTHORITY ESTIMATES QA PROCESS QA Panel Provisional Acceptance

76
Level 2 checks Address Register / Questionnaire Tracking analysis: Reconciliation against dummy forms and source updates, CE counts and second address counts Demographic indicators: Household size by ethnic group Administrative source comparisons for key population sub-groups: Students, armed forces personnel, gypsies and travellers, school children pensioners, migrants, etc.

77
Options for adjusting Census population estimates Alternative post-stratification of the Dual System Estimation Alternative post-stratification of areas Borrow strength between areas Use visitor / multiple enumeration / student reconciliations to revise populations in the coverage assessment process Calibration to: –national sex ratio etc –alternative administrative source –estimate from analysis of Longitudinal Study members Triple System Estimation

78
Implement adjustment options LA estimate Level 1 checks QA Panel reviews LA estimates along with national and local reconciliation Level 2 checks QA Panel Rejects QA Panel Accepts Proceed to imputation LOCAL AUTHORITY ESTIMATES QA PROCESS Level 3 checks QA Panel recommendation to ONS senior managers QA Panel Provisional Acceptance QA Panel Rejects

79
Level 3 checks Applied on the fully adjusted Census database Provide a check on the plausibility of estimates for key population sub-groups Include validation of key variables / distributions Final check on demographic indicators

80
LA engagement objectives for Census QA To improve LAs’ understanding and confidence in the Census results o Presentation of Census QA information at stakeholder events o Feedback received at working / advisory groups o Publication of key materials To develop the best possible understanding of each LA’s population ahead of the Census o Census Liaison Manager user guide o QA studies o LA pilot

81
LA engagement key tasks TaskDate ONS contacts pilot LAs and requests dataDec 09 Pilot LAs send intelligence to ONSEnd Jan 10 ONS assesses evidence and evaluates pilotMid March 10 ONS begins QA studiesEarly April 10 LAs in QA studies return intelligence for assessmentEnd June 10 Remaining LAs provide intelligence to ONSEnd Sept 10 ONS assesses remaining LAs intelligenceEnd March 11

82
Indicative timetable for 2009 - 2011 analysis plan Analysis plan in preparation for LA validation / contingency AnalysesPilot LAsQA studiesRemaining LAs Level 1 checksOct 09 - Mar 10Mar 10 - July 10July 10 - Dec 10 New administrative microdata* Oct 09 - Mar 10Mar 10 - July 10TBA Data matching pilots Feb 10 - May 10TBA *School Census, HESA, Migrant Worker Scan, Patient Registers, DWP LS Master Index, Welsh School Census, Project Semaphore, Claimant Count Cohort, GENSERV

83
CLOSE

84
Comparator data

85
Improving Migration Statistics ONS Centre for Demography Centre for Demography

86
Indicative impacts Impacts are indicative –so will change before final publication in May 2010 Revisions are distributional –No significant effect at England and Wales level –Improving internal and international migration distributions Aim is successive improvements to estimates at LA level –So better comparison to 2011 Census

87
Distribution of impact across all local areas 2002 to 2008 Camden has been excluded from this chart

88
Cumulative percentage revision to mid-2008 population as a result of improvements to migration estimates

89
Background Importance of migration: –Key component of population change –Changing society –Economic situation Drivers for improvement work: –relevant statistics –multiple purposes and customers –timeliness, quality Census provides benchmark –Migration estimates used to measure population between censuses

90
Migration: Front page news

91
Context - Change

92
International moves. Over seven years mid-2002 to mid- 2008 Internal moves across an LA boundary. Over seven years mid-2002 to mid- 2008.

93
Vision Migration and Population Statistics meeting user needs: -At the right time -Covering the relevant populations -Measuring change accurately (national and local) -Detecting turning points And are trusted as authoritative: -Based on range of developed best up to date sources -Enhanced, transparent, sustainable, statistical methods -With quality measures By highly engaged users
 -Detecting turning points And are trusted as authoritative: -Based on range of developed best up to date sources -Enhanced, transparent, sustainable, statistical methods -With quality measures By highly engaged users")
94
Improvements already delivered Improvements to methods in 2007 –distribution of migration, emigration modelling Improved port survey –Better coverage of migrants at key ports in IPS Improved migration reporting –Quarterly report and less confusion on multiple outputs across government Indicators of migration and improved timeliness National Estimates of short-term migration

95
Early indicator of migration

96
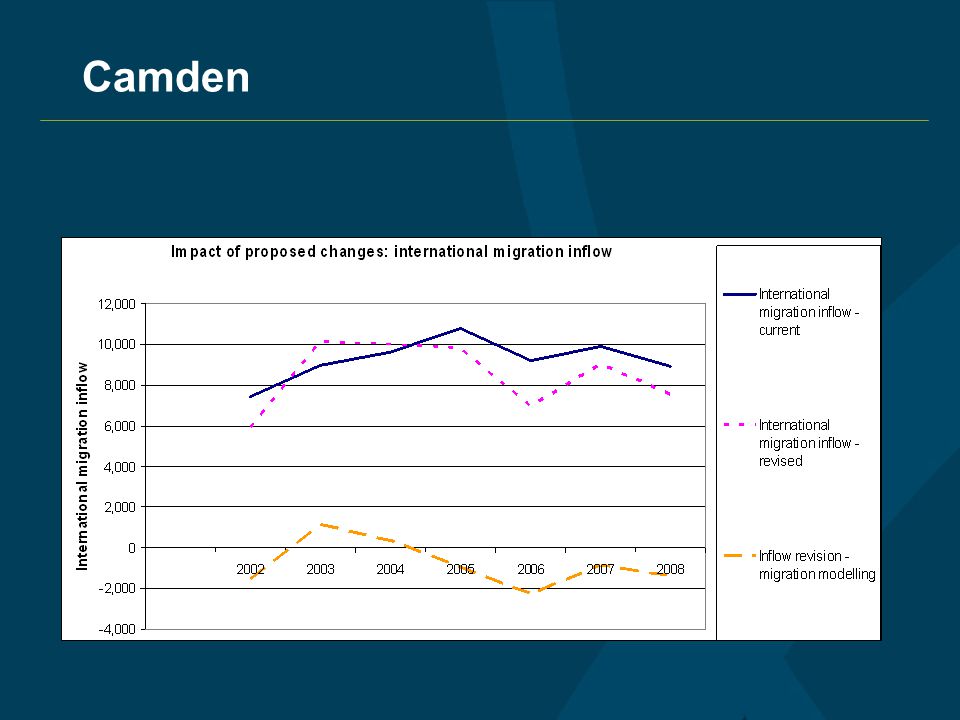
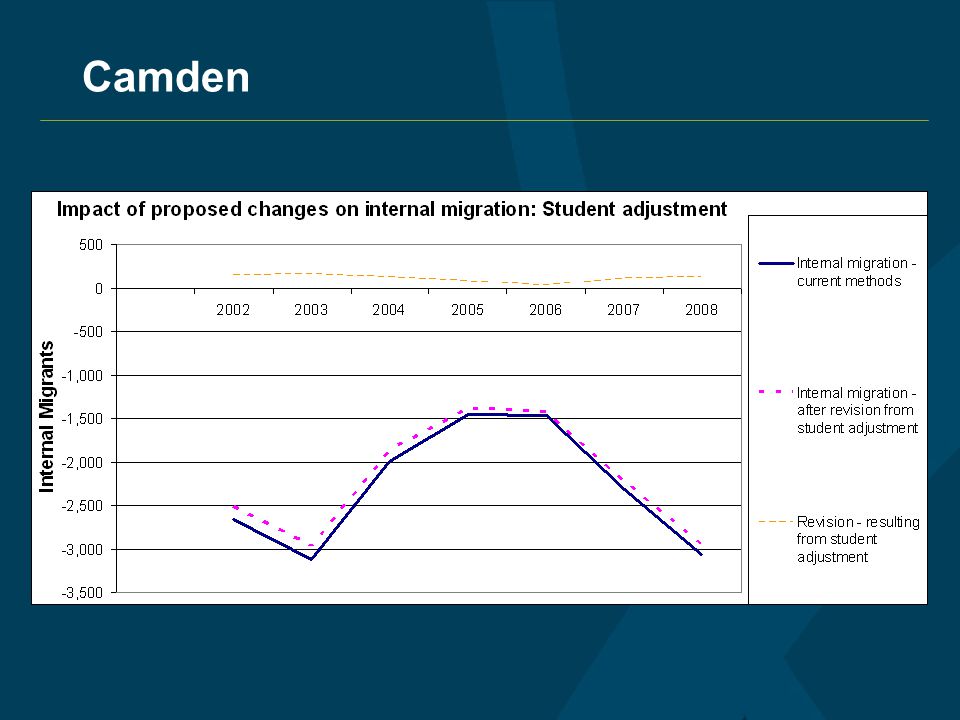
Issues Addressed By Improvements 1. Internal migration (within England & Wales) Internal migration estimates dependent on all individuals re-registering quickly with a GP when they move Some students are slow to re-register when they move to university and/or when they move at the end of their studies 2. International immigration 2001 Census data currently used to distribute immigration between local areas Doesn’t reflect changes between 2001 and 2008
 Internal migration estimates dependent on all individuals re-registering quickly with a GP when they move Some students are slow to re-register when they move to university and/or when they move at the end of their studies 2. International immigration 2001 Census data currently used to distribute immigration between local areas Doesn’t reflect changes between 2001 and")
97
Improvements that change previously published numbers Student adjustments using HESA data –HESA data of student residential (term-time) addresses –Compare against GP lists by single year of age and sex –Adjust where current data underestimates student flows Distribution of international immigration using administrative and other sources –Using a model to replace Census data Refined model for emigration data –Listened to comments on earlier model –Learned lessons from immigration modelling –New model better reflects nature of data –Immigration main driver for emigration distribution
 addresses –Compare against GP lists by single year of age and sex –Adjust where current data underestimates student flows Distribution of international immigration using administrative and other sources –Using a model to replace Census data Refined model for emigration data –Listened to comments on earlier model –Learned lessons from immigration modelling –New model better reflects nature of data –Immigration main driver for emigration distribution")
98
The Future More extensive use of administrative data for statistical purposes –More data sharing gateways –Linking and matching between sources Use of new data sources –e-Borders roll-out Better quality measures –Ability to make statements about confidence in figures 2011 Census –Basis of estimation for the next decade

99
User Engagement Centre for Demography

100
Overview Aims of user engagement Timetable Supporting material How to respond What we’ve learned from QA groups Refinements

101
Aims of user engagement Provide all users with the opportunity to comment and ask questions Seek user responses to specific questions Document clearly the changes being made and the indicative impacts Concurrent user engagement - Consultation on subnational population projections for England

102
Timetable User Engagement - 30 November to 18 January BSPS Discussion Session on Improvements - 7 January (Leeds) & 11 January (London) Final Impacts Summary - March/April Publication of Subnational Population Projections & Revised Mid-year Estimates (mid-2002 to mid-2008) - 27 May Publication of Mid-2009 Population Estimates - 24 June
 & 11 January (London) Final Impacts Summary - March/April Publication of Subnational Population Projections & Revised Mid-year Estimates (mid-2002 to mid-2008) - 27 May Publication of Mid-2009 Population Estimates - 24 June")
103
Key documents published on November 30 www.statistics.gov.uk/imps Introduction paper Overarching paper Feedback form on the improvements Impact paper Impact tables & charts Frequently asked questions

104
Supporting Documentation Published www.statistics.gov.uk/imps Students adjustment & migration modelling Methodology papers Impact assessments and validation Further work Other Reports Assessment of Demographic Rates Review of QA Activities Report on International Students in Communal Establishments Local Area Short-term Immigration Estimates Report on change to use of Irish migration data

105
How to respond imps@ons.gov.uk Feedback questionnaire Responses supported by relevant information Questions for clarification

106
Feedback Received from QA Groups Local Insight Reference Panel (LIRP) Tees Valley London Kent Birmingham Oxford Bristol Milton Keynes Expert Peer Review Group Pete Boden (University of Leeds) Paul Williamson (University of Liverpool) James Raymer (University of Southampton) Tony Champion (University of Newcastle)
 Tees Valley London Kent Birmingham Oxford Bristol Milton Keynes Expert Peer Review Group Pete Boden (University of Leeds) Paul Williamson (University of Liverpool) James Raymer (University of Southampton) Tony Champion (University of Newcastle)")
107
Feedback from LIRP Overall Fertility rates are a useful way of demonstrating impacts Impacts are generally plausible but some changes more difficult to interpret Migration Modelling Issues with sources used in models Scope for changing ‘intermediate geographies’ Need for more technical information Student Adjustment Total population of students would provide useful context Student adjustments look plausible in areas with large student populations

108
Feedback from Expert Group Overall Appreciated need for proposed improvements Recommended a framework to consider migration Regional immigration methods need further research Migration Modelling Complexity / accuracy balance Constraining model based estimates Broadening models – across years and/or combining immigration and emigration Student Adjustment How census data was used in the adjustment Clarification on double counting moves Short-term Migration Definition used and seasonality in series

109
Refinements Migration Modelling Intermediate geography? Additional factors entered into models Refinement of factors already entered Student Adjustment Proportion of foreign students remaining in UK after studies Imputation of term-time address Area specific issues – Warwick/Coventry Final Impacts of Methodological changes March/April

110
2008-based Subnational Population Projections Trend based projections for England –covers years 2008 to 2033 (25 year period) –reflect indicative mid-2004 to mid-2008 population estimates –produced for GORs, LAs, PCOs and SHAs –consistent with National Population Projections Available for CLG and DH to use in resource allocation Incorporates improvements to projections methods Consultation on migration assumptions –30 November 2009 to 18 January 2010
 –reflect indicative mid-2004 to mid-2008 population estimates –produced for GORs, LAs, PCOs and SHAs –consistent with National Population Projections Available for CLG and DH to use in resource allocation Incorporates improvements to projections methods Consultation on migration assumptions –30 November 2009 to 18 January 2010")
111
Wales Sub-national projections Responsibility of the Welsh Assembly Government Involvement of Wales Sub-national Population Projections Working Group Local Authority projections for the years 2008 to 2033 will be published in May 2010 using revised population base and revised migration data National Park projections will also be published at a later date Broadly same method as for 2006-based projections

112
Improvements to Migration and Population Statistics Indicative impacts Centre for Demography

113
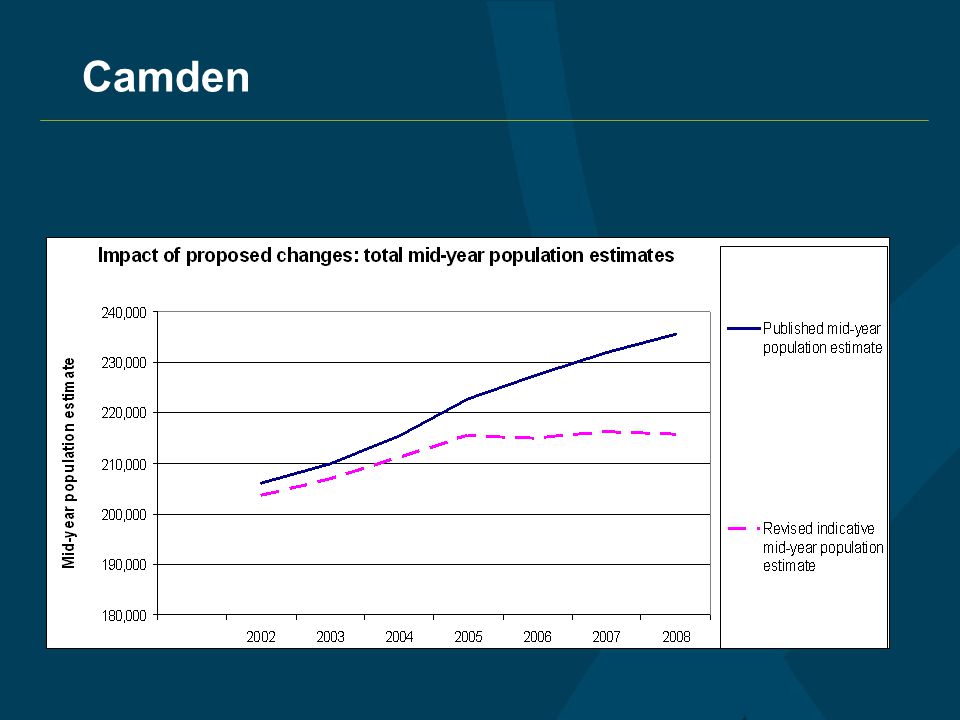
Indicative impacts How revisions have an effect Distribution of revisions An example of components of change Areas with biggest Changes Camden - a case study Demonstrating an improvement

114
Indicative impacts Impacts are indicative –Data will change –Small changes in most areas –Some areas may change substantially Impacts will change because of –Further work –Results of the comments received –Final LA results summary will be published March/April 2010 full results will be published May 27 2010

115
How the changes have an effect Difference in 2008 population estimates -> Cumulative change to migration data

116
Components of change Each revision +ve or –ve Revisions interact Changes data from 2002 to 2008 Students adjustment to internal migration –Moves to university –Moves after university –Double counting adjustment International migration –Modelling in-migration –Updated out-migration model Other changes (small)
")
117
Distribution of impact across all local areas 2002 to 2008 Camden has been excluded from this chart

118
Cumulative percentage revision to mid-2008 population as a result of improvements to migration estimates

119
Cumulative revision to mid-2008 population as a result of improvements to migration estimates

120
Main cause for cumulative revision to mid-2008 population

121
Changes at local authority level Changing distribution of internal and international migration at LA level Biggest cause of change at LA level tends to be international migration re- distribution –But notable exceptions Cause of change shown in Table 2 –In delegate packs.

122
Example – Manchester Cumulative revisions 2002 to 2008 Centre for Demography

123
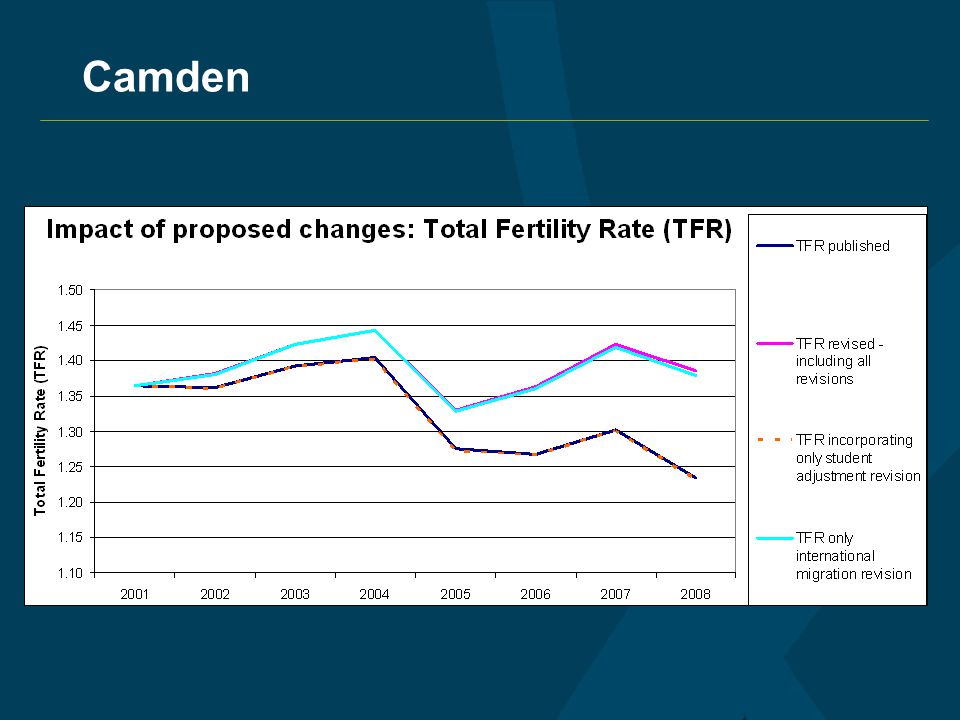
Manchester revisions Revisions: Net student: 5,700 Net international: -1,700 Other Changes: 500 Total revision: 4,500

124
Manchester revisions Revisions: Net student: 5,700 Net international: -1,700 Other Changes: 500 Total revision: 4,500

125
Manchester revisions Revisions: Net student: 5,700 Net international: -1,700 Other Changes: 500 Total revision: 4,500

126
Manchester revisions Revisions: Net student: 5,700 Net international: -1,700 Other Changes: 500 Total revision: 4,500

127
Manchester revisions Revisions: Net student: 5,700 Net international: -1,700 Other Changes: 500 Total revision: 4,500

128
Manchester revisions Revisions: Net student: 5,700 Net international: -1,700 Other Changes: 500 Total revision: 4,500

129
Manchester revisions Revisions: Net student: 5,700 Net international: -1,700 Other Changes: 500 Total revision: 4,500

130
Manchester revisions Revisions: Net student: 5,700 Net international: -1,700 Other Changes: 500 Total revision: 4,500

131
Manchester revisions Revisions: Net student: 5,700 Net international: -1,700 Other Changes: 500 Total revision: 4,500

132
Manchester revisions Revisions: Net student: 5,700 Net international: -1,700 Other Changes: 500 Total revision: 4,500

133
Biggest 10 percentage upward revisions by local authority Population, thousandsCurrent mid-2008 population Cumulative revision 2002 to ‘08 Percentage revision 2002 to ‘08 Annualised percentage revision Hounslow Boston Southwark Peterborough Crawley Harrow Woking South Cambridgeshire Barnet Great Yarmouth 223 58 278 164 101 216 92 139 332 94 11 3 11 7 4 8 3 4 10 3 5.0 4.7 4.1 4.0 3.7 3.2 2.9 2.8 0.7 0.6 0.5 0.4 Excludes City of London and Isles of Scilly

134
Biggest 10 percentage downward revisions by local authority Population, thousandsCurrent mid-2008 population Cumulative revision 2002 to ‘08 Percentage revision200 2 to ‘08 Annualised percentage revision Camden Cambridge Elmbridge Forest Heath Oxford S’th Northamptonshire Durham Ceredigion Rutland Brent 236 123 132 65 154 91 96 78 39 271 -20 -7 -3 -7 -4 -3 -2 -9 -8.5 -5.7 -5.2 -5.1 -4.8 -4.3 -4.2 -4.0 -3.9 -3.5 -1.1 -0.8 -0.7 -0.6 -0.5

135
National and regional indicative impact population thousandsCurrent mid- 2008 population Cumulative effect of change Cumulative revision 2002 to ‘08 Annualised percentage revision England and Wales England North East North West Yorkshire & Humber East Midlands West Midlands East London South East South West Wales 54,440 51,446 2,575 6,876 5,213 4,433 5,411 5,729 7,620 8,380 5,209 2,993 10 13 1 -5 -4 -16 58 -16 -4 - -3 0.02 0.03 -0.04 0.01 0.02 -0.11 -0.07 -0.28 0.76 -0.20 -0.08 -0.11 0.00 -0.01 0.00 -0.02 -0.01 -0.04 0.11 -0.03 -0.01 -0.02

136
Formal Tables Summary Tables –Table 1: Total impact by year Table 1b: Biggest 20 increases, mid-2008 Table 1c: Biggest 20 decreases, mid-2008 –Table 2: Cumulative effect by adjustment, mid-2008 Detailed –Table 3: Annual and cumulative students effect –Table 4: Annual and cumulative effect of net international migration –Table 5: Annual and cumulative effect of other changes Very Detailed –Table 6: Net and gross students effects, by type of flow (to study, post study, and counter adj.) –Table 7: Net and gross international migration –Table 8: Size of increase in student flows, by type of flow Context –Table 9: Short-term and long-term international immigrants, mid-2007 Tables are by LA, county, GOR, etc, and for all years mid-2002 to mid-2008 (except where single year is indicated). Some material by age and sex available on request.

137
Charts Available All charts are by local authority Student adjustment and internal migration –Adjustment as percentage of student flows International migration –Net –In –Out Total change and total effect Total fertility rate

138
Case Study - Camden Centre for Demography

139
Camden Births

140
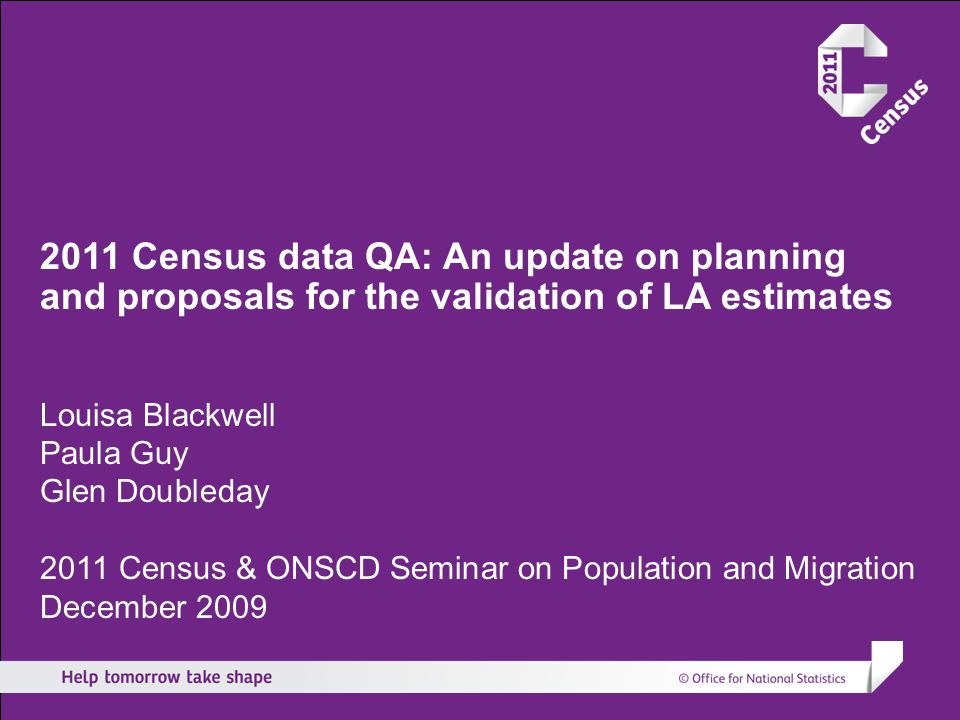
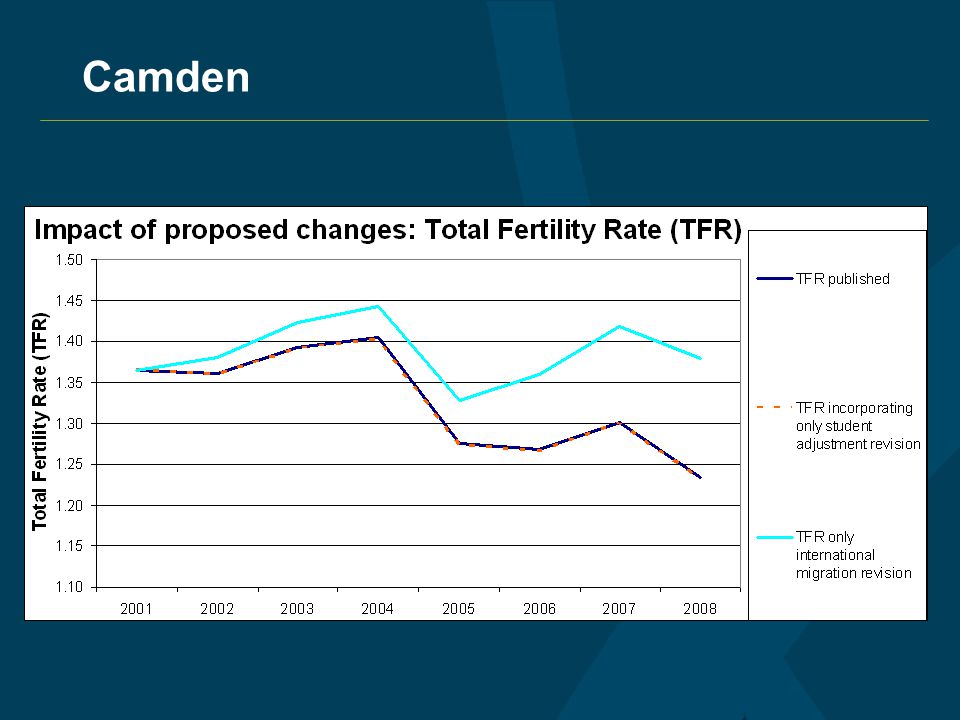
Camden

148
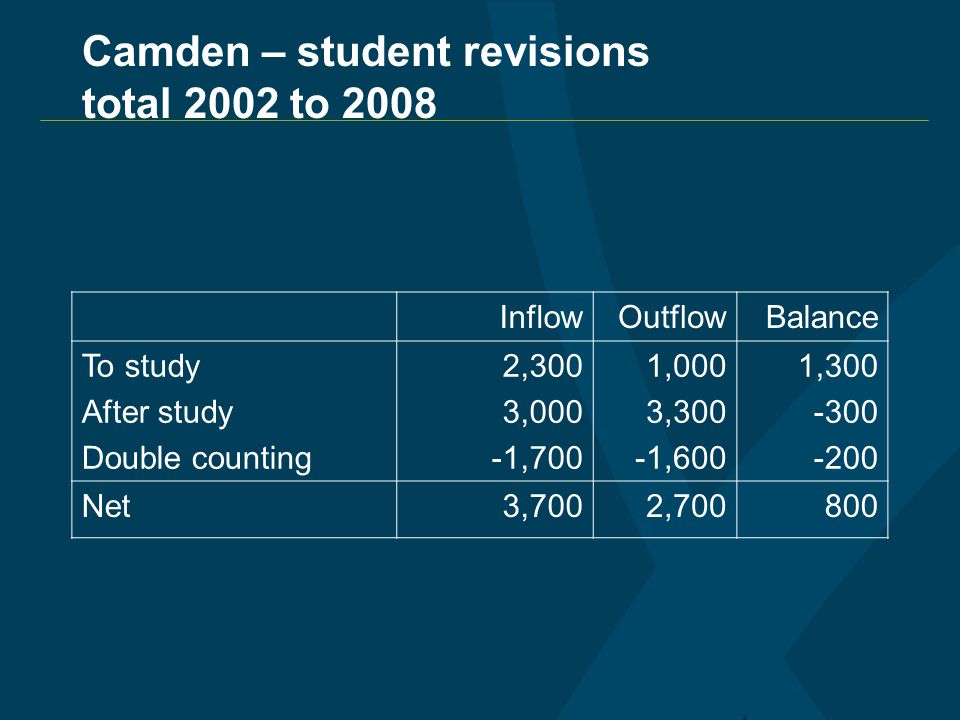
Camden – student revisions total 2002 to 2008 InflowOutflowBalance To study After study Double counting 2,300 3,000 -1,700 1,000 3,300 -1,600 1,300 -300 -200 Net3,7002,700800

149
Camden

150
Demonstrating an improvement Centre for Demography

151
Issues to be addressed by the new methodology… Some young people, particularly young men, not changing their GP registration soon after they move Students a sub-set of young people, who necessarily cluster in certain areas of the country Affects estimation of students moving to university and moving away after their studies Some encouragement to change GP registration at start of studies, but no encouragement when students leave

152
Solution: what’s new? Higher Education Statistics Agency (HESA) data Data on all HE students New term-time postcode detail collected by HESA for all institutions from 2007/08 academic year New detail received March 2009
 data Data on all HE students New term-time postcode detail collected by HESA for all institutions from 2007/08 academic year New detail received March")
153
Modelling in-migration Current method uses 2001 Census data to distribute to LA level Clear changes in migration trends since 2001 e.g. EU accession Concept proved with introduction of local authority out-migration models in 2007

154
What modelling achieves Improves timeliness at LA level Potential use of administrative data GP registrations (Flag 4s) National Insurance Number (NINo) allocations to overseas nationals Annually updated counts available Provide counts at local authority level
 National Insurance Number (NINo) allocations to overseas nationals Annually updated counts available Provide counts at local authority level")
155
Demonstrating an improved methodology Student adjustment uses data from an independent source that gives actual student moves missed by patient registers Student adjustments after study –Carefully verified by other data –Based on known student numbers –Using distributions which have been carefully corroborated International immigration estimation model –Uses updatable sources to distribute instead of fixed 2001 Census data –Model makes use of the best features from a range of administrative and other sources –Minimises the impact of definitional issues with administrative sources International emigration model –Updated to reflect comments made previously –More technically robust –Better reflects data structure –Incorporates improved immigration data

156
Demonstrating an improvement Demographic analysis shows improvement in key areas (e.g. Camden) Analysis of student areas shows much more plausible age profiles after student adjustment (see June Roadshow slides)
 Analysis of student areas shows much more plausible age profiles after student adjustment (see June Roadshow slides).")
157
Indicative results: Ceredigion mid 2007 population

158
Quality assuring the improvement Giving all users a chance to comment Extensive and rigorous internal quality reviews Using local insight to: –Develop and refine methods –Sense check the results Extensive peer review

159
Short-term Immigration Estimates at Local Area Level Centre for Demography

160
Introduction Local Authority level short-term immigration estimates published for first time in October 2009 as part of a research report Estimates are available for: The year to mid-2007 In-flows only Moves made for between 1 and 12 months All reasons for visit (with a worker/non-worker breakdown provided) England & Wales level estimates previously published for mid-2004 to mid-2007
 England & Wales level estimates previously published for mid-2004 to mid-2007")
161
Total Short-term visits: Top Ten Areas RankLocal AuthorityEstimate 1Westminster62,800 2Manchester35,900 3Birmingham33,000 4Ealing29,200 5Camden28,000 6Barnet23,500 7Brent21,600 8Southwark21,300 9Oxford19,500 10Wandsworth18,800

162
Research Report Sets out detailed methodology Data used Differences between methods for workers and non- workers How final approach was chosen Summarises validation work Statistical assessment of model validity/stability Assessment by Reason for Visit Assessment of areas with largest worker estimates Use of HESA data for international short-term students

163
Regional Level Immigration Estimates RegionEstimate% of England & Wales Total England1,295,00097% North East 28,0002% North West 120,0009% Yorkshire & The Humber 85,0006% East Midlands 80,0006% West Midlands 97,0007% East 113,0008% London 480,00036% South-East 199,00015% South-West 92,0007% Wales40,0003%

164
Reason for Visit Reason For VisitEstimate% of England & Wales Total Work175,00013% Study199,00015% Visiting Friends or Family538,00040% Join/Accompany11,0001% Business120,0009% Holiday214,00016% Other77,0006% Total1,334,000100%

165
Short-term Immigrant Workers: Top Ten Areas RankLocal AuthorityEstimate 1Newham4,400 2Brent4,300 3Ealing4,000 4Birmingham3,600 5Manchester3,100 6Haringey3,100 7Waltham Forest2,900 8Tower Hamlets2,800 9Hounslow2,700 10Wandsworth2,600

166
Short-term International Students: Top Ten Areas from HESA data Local AuthorityHESA Estimate of Short-term Immigrant Students % of Short-term Immigration Estimate Camden5,20019% Manchester4,00011% Cardiff3,90032% Islington3,90025% Newham3,80021% Newcastle upon Tyne3,80040% Coventry3,20030% Birmingham2,9009% Tower Hamlets2,80017% Leeds2,80015%

167
Conclusions Current methodology and estimates are initial work Feedback is being sought from users to inform further research Aim to publish mid-2008 local authority estimates in May 2010

Similar presentations


 Local.>")


