Download presentation
Presentation is loading. Please wait.

1
Educational Attainment and Income Inequality in Southeast Missouri Kang H. Park Professor of Economics Southeast Missouri State University

2
Introduction Human capital theory: –Educational spending is an investment because it increases worker productivity. –Human capital theory is used to explain income differentials. This study examines the effects of educational variables on income and income inequality in Southeast Missouri, using the 2000 US census data covering 34 Southeast Missouri counties. Gini index from B. Domazlicky’s 2005 article.

3
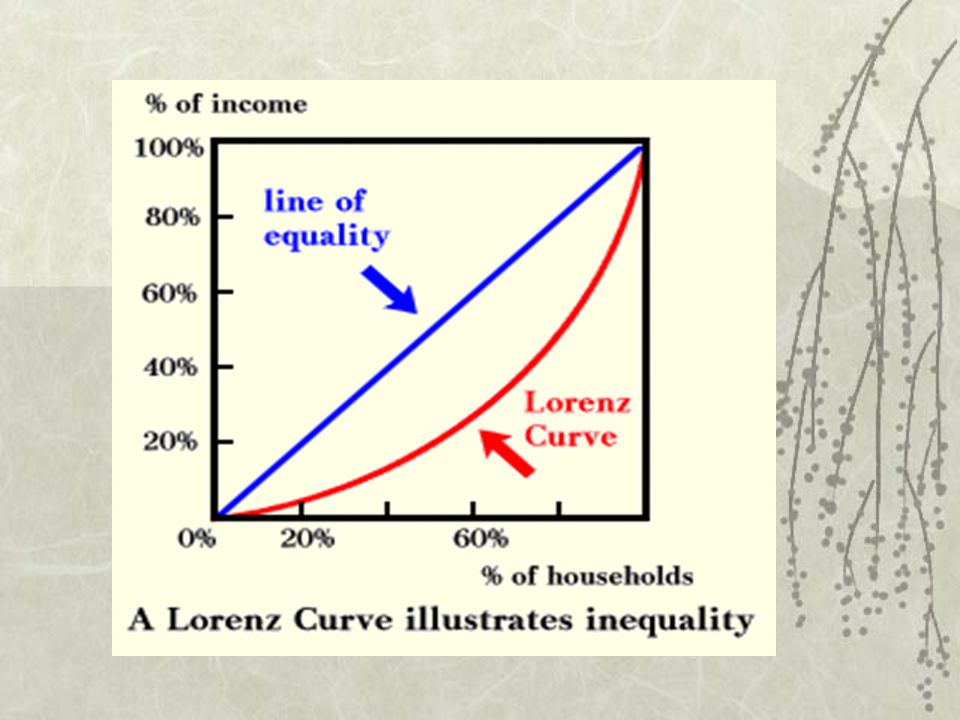
VariableMinimumMaximumMean Standard deviation EDMEAN 10.98 (Pemiscot) 12.94 (Pulaski) 11.790.388 EDSD 2.52 (Miller) 3.61 (Pemiscot) 2.900.260 EDCV 0.206 (Camden) 0.328 (Pemiscot) 0.2470.029 Household Income (HINCOME) $28,978 (Shannon) $47,221 (Camden) $36,170$4,578 Family Income (FINCOME) $11,492 (Shannon) $55,283 (Cape Girardeau) $41,401$5,329 Per Capita Income (CAPITA) $11,492 (Shannon) $20,197 (Camden) $14,520$1,768 Poverty Rate (POVERTY) 8.2 (Ste. Genevieve) 30.4 (Pemiscot) 18.25.21 Gini Index (GINI) 0.336 (Pulaski) 0.481 (Pemiscot) 0.4040.033 Descriptive Statistics EDMEAN: Average years of schooling EDSD: Standard deviation of years of schooling EDCV: Coefficient of variation of years of schooling, EDSD/EDMEAN Gini Index (GINI): measure of income inequality
 30.4 (Pemiscot) Gini Index (GINI) (Pulaski) (Pemiscot) Descriptive Statistics EDMEAN: Average years of schooling EDSD: Standard deviation of years of schooling EDCV: Coefficient of variation of years of schooling, EDSD/EDMEAN Gini Index (GINI): measure of income inequality.")
5
Southeast Missouri Data CountyedmeanedsdedcvpopHincomeFincomecapitapovertyGini Butler12.0472.9717140.2466774086738000451571572118.60.4477 Bollinger11.4712.8588340.2492231202935413403711364113.80.3586 Camden12.79552.6314080.2056513705147221530002019711.40.4152 Cape_Girardeau12.9123.0425820.235646869346272552831859311.10.3834 Carter11.62353.1040860.267053594133143360641334925.20.4207 Crawford11.772.6701080.2268572280437726433561482516.30.3883 Dent11.58052.9412260.2539811492735513403331446317.20.3935 Douglas11.7822.8407130.2411061308434605378641378517.50.3956 Dunklin11.27353.3150.2940623315533066381391335124.50.4262 Howell12.042.6840330.2229263723834427394181395918.70.4127 Iron11.50353.065860.26649210697354154163714227190.4303 Laclede12.0472.5724380.2135333251339479431911557214.30.3962 Madison11.5852.8386240.2450261180032092369491321517.20.3992 Maries11.9292.7381150.229534890338570440311566213.10.3496 Miller12.072.5246020.2091552356437978435351514414.20.3673 Mississippi11.19553.3642150.3004971342732139379761303823.70.445 New_Madrid11.23.4191560.3040871976035027404671420422.10.4292 Oregon11.71952.7904440.23810310344306353525712812220.4256 Ozark11.82.6410910.2225679.54233776382891413321.60.4281 Pemiscot10.98353.6070010.3284022004732372378611296830.40.4809 Perry11.7352.7731940.2363181813242693500721655490.3455 Phelps12.8033.1309310.2445473982538894465191608416.40.3942 Pulaski12.9372.6921440.2080964116540442435271458610.30.336 Reynolds11.50252.7608790.240024668931450360641306520.10.3812 Ripley11.3443.0978610.27308413509314643542012889220.417 StFrancois12.0362.7302660.2268425564138872442701527314.90.3816 SteGenevieve11.8412.62890.2201178424628951897172838.20.3524 Scott11.8632.8580320.240924042239705455701562016.10.3951 Shannon11.54652.6598150.230357832428978336381149226.90.4416 Stoddard11.57953.0369080.2622662970535859414621465616.50.4062 Texas11.8982.7465140.2308382300333219377971379921.40.427 Whashington11.35653.0066160.2647482334434980399801293420.80.4225 Wayne11.16653.1366370.2808971325931928367661343421.90.429 Wright11.7982.847020.2413141795532144364611313521.70.4064

7
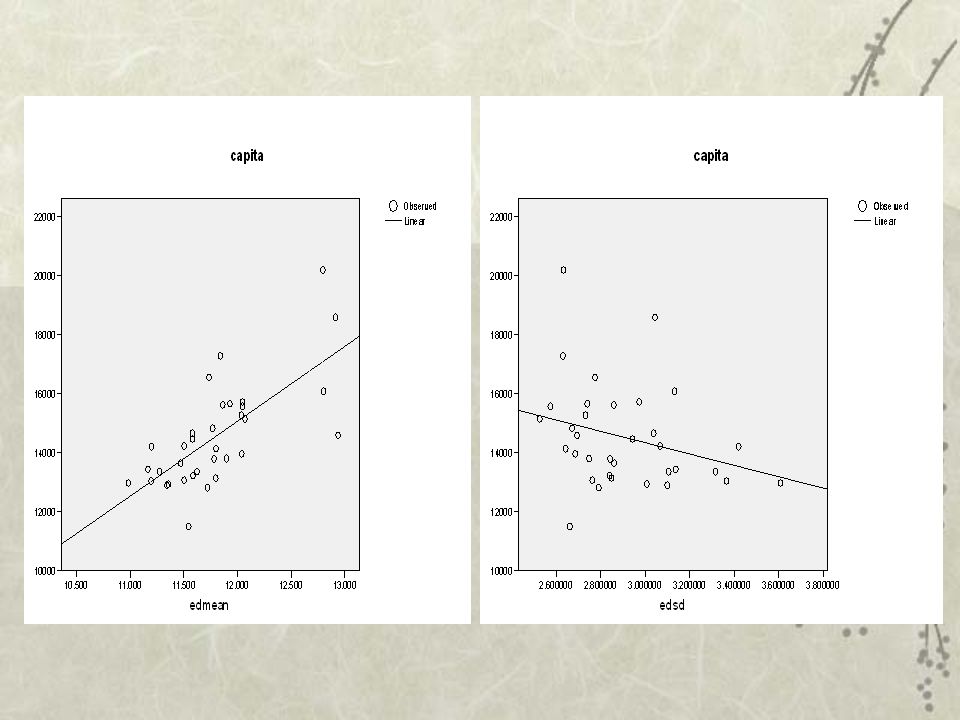
Dependent Variable: Income Per Capita IncomeHousehold IncomeFamily Income Intercept-18816 (-2.334)*-42875 (-2.015)*-58864(-2.311)* EDMEAN2690 (5.084)**6597 (4.723)**7881(4.714)** EDSD561 (0.565)442 (0.169)2540 (0.809) Adjusted R 2 0.4660.4450.413 F-value15.4014.2212.62 Regression of income on education variables N=34 Numbers in parentheses are t-values. ** The variable is significant at the 0.01 level and * The variable is significant at the 0.05 level.

10
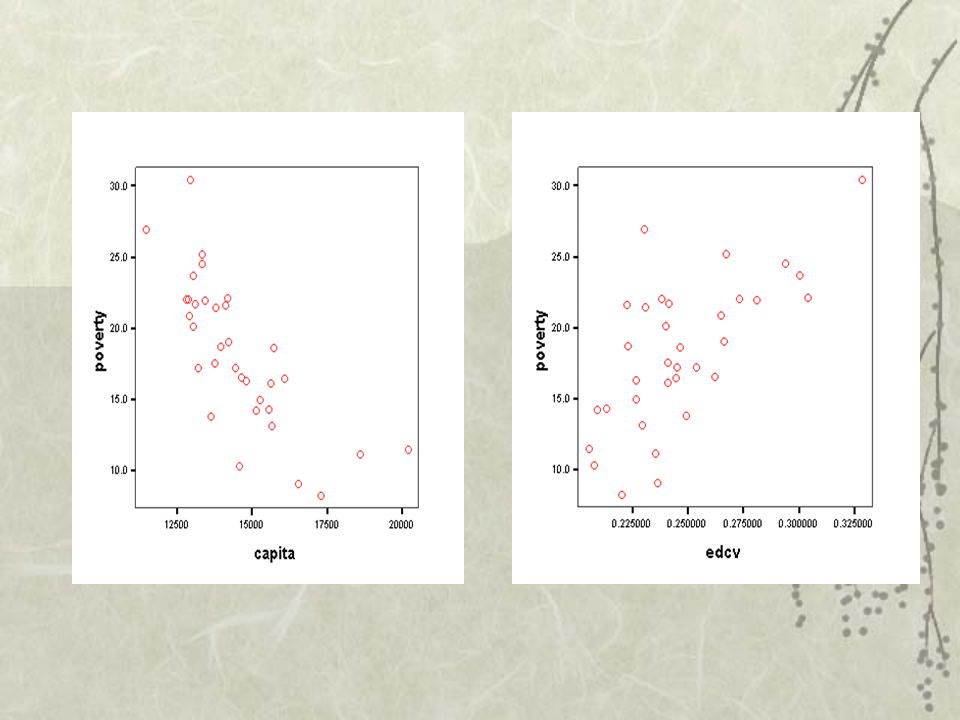
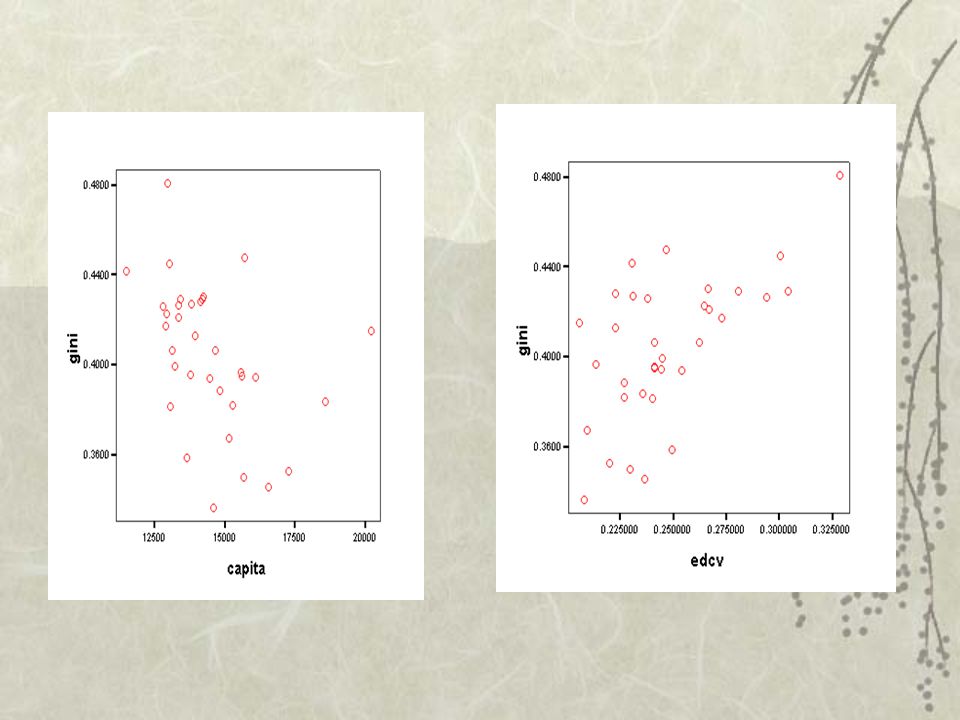
Dependent Variable Poverty Rate Gini Index Intercept289.81(6.206)**260.21 (5.518)**1.02 (2.305)*0.82 (1.841) LnCapita-30.88 (-5.277)**-27.10 (-5.784)**-0.08 (-1.415)-0.06 (-1.317) EDMEAN-0.149 (-0.098)-0.003 (-0.215) EDSD7.68 (3.603)**0.059 (2.905)** EDCV70.97 (3.826)**0.58 (3.339)** Adjusted R 2 0.7190.7200.3540.371 F29.1943.307.0310.74 Regression of income inequality on income and education variables N=34 LnCapita: natural logarithm of per capita income Numbers in parentheses are t-values. ** The variable is significant at the 0.01 level and * The variable is significant at the 0.05 level.

11
Summary A higher levels of income and education have an equalizing effect on income distribution The dispersion of schooling has a disequalizing effect on income distribution. Both LnCapita and EDSD (or EDCV) are statistically significant in explaining the poverty rate. only EDSD(or EDCV) can explain the Gini index well.
 are statistically significant in explaining the poverty rate. only EDSD(or EDCV) can explain the Gini index well..")
Similar presentations