Download presentation
Presentation is loading. Please wait.

1
Chapter 7 Estimation

2
Point Estimate an estimate of a population parameter given by a single number

3
is used as a point estimate for s is used as a point estimate for . Examples of Point Estimates

4
Error of Estimate the magnitude of the difference between the point estimate and the true parameter value

5
The error of estimate using as a point estimate for is:

6
Confidence Level A confidence level, c, is a measure of the degree of assurance we have in our results. The value of c may be any number between zero and one. Typical values for c include 0.90, 0.95, and 0.99.

7
Critical Value for a Confidence Level, c the value z c such that the area under the standard normal curve falling between – z c and z c is equal to c.

8
Critical Value for a Confidence Level, c P(– z c < z < z c ) = c -z c z c
 = c -z c z c")
9
Find z 0.90 such that 90% of the area under the normal curve lies between z -0.90 and z 0.90 P(-z 0.90 < z < z 0.90 ) = 0.90 -z 0.90 z 0.90.90
 = z 0.90 z")
10
Find z 0.90 such that 90% of the area under the normal curve lies between z -0.90 and z 0.90 P(0< z < z 0.90 ) = 0.90/2 = 0.4500 -z 0.90 z 0.90.4500
 = 0.90/2 = z 0.90 z")
11
Find z 0.90 such that 90% of the area under the normal curve lies between z -0.90 and z 0.90 According to Table 4 in Appendix I, 0.4500 lies roughly halfway between two values in the table (.4495 and.4505). Calculating the invNorm(0.05) gives you the critical value of z 0.90 = 1.6449.
 gives you the critical value of z 0.90 =")
12
Common Levels of Confidence and Their Corresponding Critical Values Level of Confidence, cCritical Value, z c 0.70 or 70%1.0364 0.75 or 75%1.1503 0.80 or 80%1.2816 0.85 or 85%1.4395 0.90 or 90%1.6449 0.95 or 95%1.9600 0.98 or 98%2.3263 0.99 or 99%2.5758 0.999 or 99.9%3.2905

13
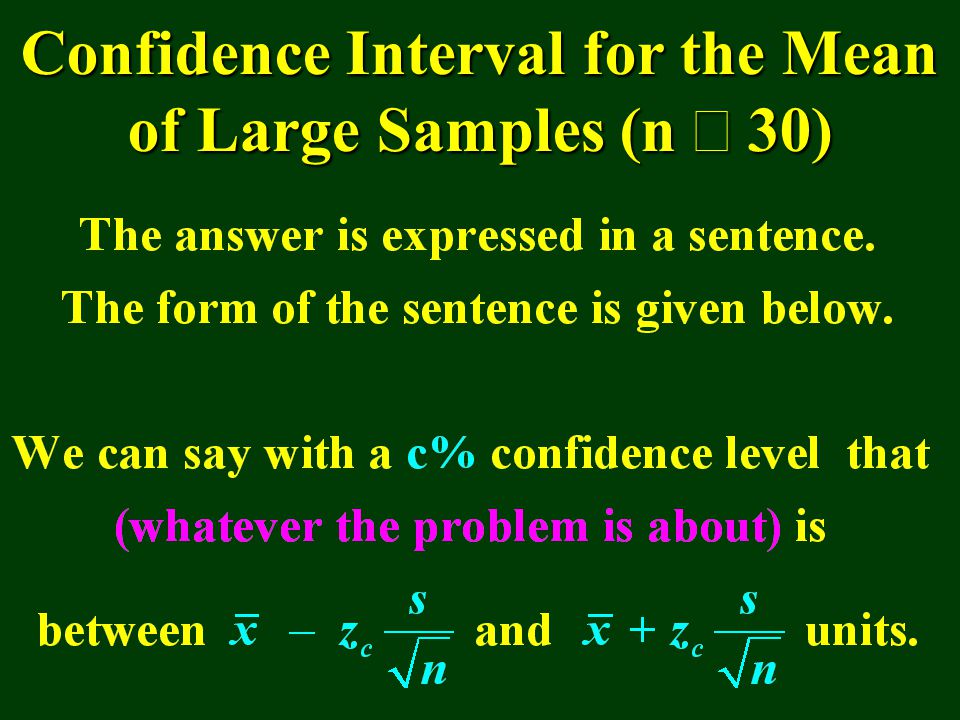
Confidence Interval for the Mean of Large Samples (n 30)
")
15
Create a 95% confidence interval for the mean driving time between Philadelphia and Boston. Assume that the mean driving time of 64 trips was 5.2 hours with a standard deviation of 0.9 hours.

16
Key Information

17
95% Confidence Interval: We can say with 95% a confidence level that the population mean driving time from Philadelphia to Boston is between 4.9795 and 5.4205 hours.

18
95% Confidence Interval: We can say with a 95% confidence level that the population mean driving time from Philadelphia to Boston is between 4.9795 and 5.4205 hours. Calculator Computation

19
When estimating the mean, how large a sample must be used in order to assure a given level of confidence? Use the formula:

20
Determine the sample size necessary to determine (with 99% confidence) the mean time it takes to drive from Philadelphia to Boston. We wish to be within 15 minutes of the true time. Assume that a preliminary sample of 45 trips had a standard deviation of 0.8 hours.

21
... determine with 99% confidence...

22
... We wish to be within 15 minutes of the true time.... E = 15 minutes or E = 0.25 hours

23
...a preliminary sample of 45 trips had a standard deviation of 0.8 hours. Since the preliminary sample is large enough, we can assume that the population standard deviation is approximately equal to 0.8 hours.

24
Minimum Required Sample Size

25
Rounding Sample Size Any fractional value of n is always rounded to the next higher whole number.

26
We would need a sample of 68 trip times to be 99% confidence that the sample mean time it takes to drive from Philadelphia to Boston is within the 0.25 hours of the population mean time it takes to drive from Philadelphia to Boston.

27
THE END OF THE PRESENTATION

28
Answers to the Sample Questions

29
1.As part of a study on AP test results, a local guidance counselor gathered data on 200 tests given at local high schools. The test results are based on scores of 1 to 5, where a 1 means a very poor test result to a 5 which means a superior test result. The sample mean was 3.62 with a standard deviation of 0.84. a. Construct a 90% confidence interval for the population mean.

30
We can say with a 90% confidence level that the population mean score on AP tests at local high schools is between 3.5223 and 3.7177.

31
1.As part of a study on AP test results, a local guidance counselor gathered data on 200 tests given at local high schools. The test results are based on scores of 1 to 5, where a 1 means a very poor test result to a 5 which means a superior test result. The sample mean was 3.62 with a standard deviation of 0.84. b. Construct a 95% confidence interval for the population mean.

32
We can say with a 95% confidence level that the population mean score on AP tests at local high schools is between 3.5036 and 3.7364.

33
1.As part of a study on AP test results, a local guidance counselor gathered data on 200 tests given at local high schools. The test results are based on scores of 1 to 5, where a 1 means a very poor test result to a 5 which means a superior test result. The sample mean was 3.62 with a standard deviation of 0.84. c. Perform the calculator checks for parts a and b.

34
1. Part c - Calculator check for part a

35
1. Part c - Calculator check for part b

36
1.As part of a study on AP test results, a local guidance counselor gathered data on 200 tests given at local high schools. The test results are based on scores of 1 to 5, where a 1 means a very poor test result to a 5 which means a superior test result. The sample mean was 3.62 with a standard deviation of 0.84. d. How many test results would be require to be 95% confident that the sample mean test score is within 0.05 of the population mean score?

37
We would need to acquire 1,085 AP test results to have a 95% confidence level with an error of no more than 0.05 for the population mean AP test scores.

38
2.The SAT results for 50 randomly selected seniors are listed below. The score are based only on the English and Math portions of the SAT examination. Use your calculator to determine a 99% confidence interval for the mean score of the SAT examination. 980124013809508701030122075014101150 1280110010708909301520810109013101030 1190137012009901560810940101011401060 1060125012401130117010801210970810920 10801160940105011101300123079010501240

39
Remember that you need perform a 1-VAR- STATS calculation on the data first to get the value for the sample standard deviation.

40
We can say with a 99% confidence level that the population mean score on the SAT examination of the seniors at a local high school is between 1033.9008 and 1168.8992.

41
THE END OF SECTION 1

Similar presentations


 (Small Samples)>")

>")


 HAWKES LEARNING SYSTEMS math courseware specialists Copyright © 2008 by Hawkes Learning Systems/Quant.>")


>")