Download presentation
Presentation is loading. Please wait.

1
Prepared by: Florida International University The Metropolitan Center BROWARD AFFORDABLE HOUSING NEEDS ASSESSMENT

3
Persons Employed 0 20,000 40,000 60,000 80,000 100,000 120,000 1999 2003 Retail Trade (6% Growth) Health Care and Social Assistance (2% Growth) Administrative Support, Waste Mgt., Remediation Services (4% Growth) Accommodation and Food Services (13% Growth) Wholesale Trade (6% Growth) Source: County Business Patterns 1999-2003
 Health Care and Social Assistance (2% Growth) Administrative Support, Waste Mgt., Remediation Services (4% Growth) Accommodation and Food Services (13% Growth) Wholesale Trade (6% Growth) Source: County Business Patterns")
4
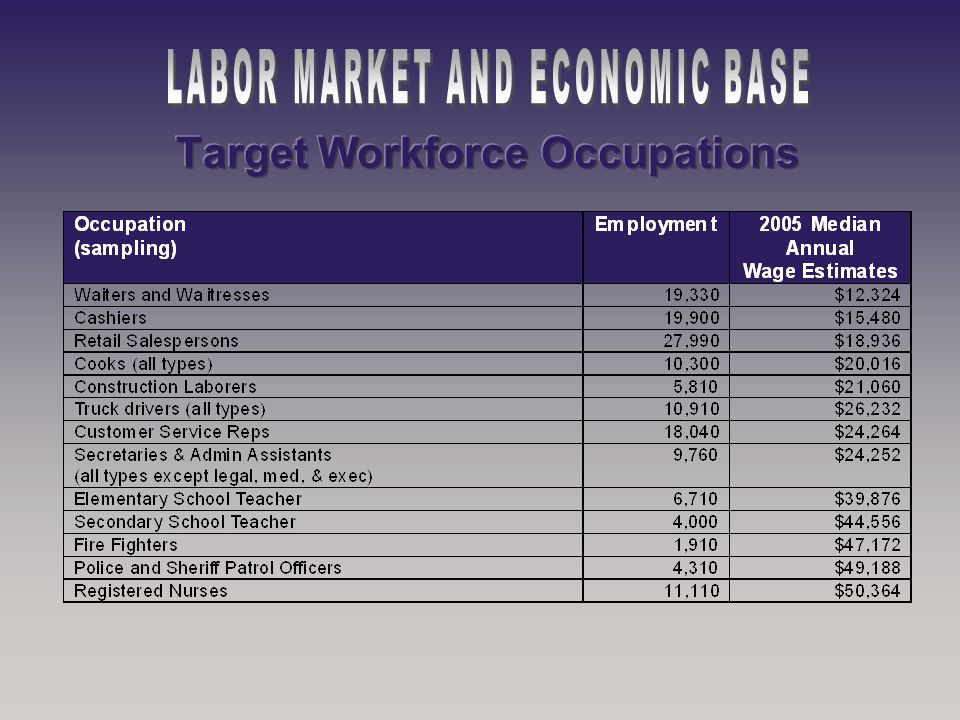
OccupationsEmployment Median Annual Income (2005) Hourly Wage (2005 Wage Estimates) EntryExperienced Retail Salespersons 27,990$18,931$7.18$14.19 Cashiers 19,990$15,475$6.47$ 9.36 Office Clerks, General 18,790$20,582$7.52$12.91 Customer Service Reps. 18,040$24,269$9.26$15.36 Waiters and Waitresses 14,330$12,326$5.99$ 7.53 All Occupations711,110$25,786$8.06$22.25 Source: Florida Agency for Workforce Innovation and US Dept of Labor 2006 State of Florida Minimum Wage: $6.40

6
$0 $50,000 $100,000 $150,000 $200,000 $250,000 $300,000 $350,000 $400,000 $450,000 2003 2005 Jacksonville (38% change) Tampa (50% change) Miami (63% change) Ft. Lauderdale (65% change) West Palm Beach (67% change) Orlando (74% change) Source: Florida Association of Realtors
 West Palm Beach (67% change) Orlando (74% change) Source: Florida Association of Realtors.")
7
02/0305/03 08/03 11/0302/0405/0408/04 11/04 02/0505/0508/0511/05 Condominium / Townhome Single Family House $108,500 $202,500 $395,000 95% $193,000 78% Source: Realtor Association of Greater Fort Lauderdale

8
Annual Increase Over 30%

9
For Sale Sold 0 1000 2000 3000 4000 5000 6000 7000 11/02 02/0305/03 08/03 11/0302/04 05/04 08/04 11/0402/0505/05 08/0511/05 Hurricane Wilma Source: Realtor Association of Greater Fort Lauderdale 4,850 2,444 6,027 907811 1,493

10
0 1000 2000 3000 4000 5000 6000 7000 11/02 02/03 05/03 08/03 11/03 02/04 05/0408/0411/04 02/05 05/05 08/05 11/05 Single Family For Sale Single Family Sold Hurricane Wilma Source: Realtor Association of Greater Fort Lauderdale 5,606 2,412 4,987 940 932 623

11
Source: 2000 US Census and Broward County Quarterly Housing Report, Third Quarter 2005: Reinhold P.Wolff Economic Research, Inc. *Survey of53,271 units

12
Source: 2005 Rental Data: Broward County Quarterly Housing Report, Third Quarter 2005: Reinhold P.Wolff Economic Research, Inc. 2002 Rental Data: U.S. Census, American Survey for 2002 (Table HO61)
.")
13
Municipalities and Percentage Condo Conversions in Rental Inventory Source: 2004 American Survey and Apartment Realty Advisors

14
Source: Broward County Certificate of Occupancy Data from 2001-2005 and 2000 Census *Assumes an average household size of 2.56, using 2005 population estimates for each municipality. *Certificates of Occupancy issued from 2000-2005

15
The projected increase of 135,797 jobs in Broward County between 2004-2012 will create the demand for approximately 90,000 additional housing units Projected job growth in Broward County will impact the supply and affordability of housing, including the level, type and location of new housing production Job growth projections for Broward County will create the demand for approximately 27,000 new workforce housing units (80-150 percent AMI), including 6,000 teachers, 3,800 registered nurses, 1,200 police and sheriff patrol officers and 400 firefighters Job growth projections for Broward County will create the demand for approximately 51,300 new affordable housing units for households earning less than 80 percent AMI
, including 6,000 teachers, 3,800 registered nurses, 1,200 police and sheriff patrol officers and 400 firefighters Job growth projections for Broward County will create the demand for approximately 51,300 new affordable housing units for households earning less than 80 percent AMI")
16
Pembroke Pines 10%

17
(Thru June) 0 2000 4000 6000 8000 10000 12000 14000 16000 19951996199719981999200020012002200320042005 Single Family UnitsMulti Family UnitsTotal Source: Broward County Quarterly Housing Report, Third Quarter 2005: Reinhold P.Wolff Economic Research, Inc.
 Single Family UnitsMulti Family UnitsTotal Source: Broward County Quarterly Housing Report, Third Quarter 2005: Reinhold P.Wolff Economic Research, Inc.")
18
Municipality Median Household Income Median Sale Price Affordable** Purchase Price Affordability Gap North Lauderdale$48,524$192,900$183,662($9,238) Pembroke Pines$64,902$280,000$256,414($23,586) Coconut Creek$53,566$215,000$188,330($26,670) Coral Springs$71,472$320,512$284,411($36,101) Hollywood$45,177$278,050$168,933($109,117) Hallandale$34,048$290,000$124,277($165,723) Miramar$61,293$410,000$239,408($170,592) Ft. Lauderdale$45,890$452,000$172,852($279,148) Source: Florida Agency for Workforce Innovation and US Dept of Labor and US Census *Median household income has been adjusted for inflation **Assumptions for affordable purchase price: 30 year fixed rate mortgage, 6.0% interest, 5% down payment, average tax of $1257 per year, and no outstanding debt. Price was determined using the online calculator from bankrate.com
 Source: Florida Agency for Workforce Innovation and US Dept of Labor and US Census *Median household income has been adjusted for inflation **Assumptions for affordable purchase price: 30 year fixed rate mortgage, 6.0% interest, 5% down payment, average tax of $1257 per year, and no outstanding debt. Price was determined using the online calculator from bankrate.com.")
19
OccupationMedian Annual Wages Affordable** Purchase Price Affordability Gap Waiters and Waitresses $12,324 $33,965$357,135 Cashiers $15,480 $47,143$343,957 Retail salespersons $18,936 $61,578$329,522 Cooks (all types) $20,016 $65,658$325,442 Construction laborers $21,060 $70,440$320,660 Truck drivers (all types) $26,232 $92,023$299,077 Customer Service Reps $24,264 $83,812$307,288 Secretaries & Admin Assistants (all types except legal & medical) $24,252$83,763$307,337 Elementary School Teacher $39,876 $148,983$242,117 Secondary School Teacher $44,556 $168,516$222,584 Fire fighters $47,172 $179,440$211,660 Police officers $49,188 $187,857$203,243
 $20,016 $65,658$325,442 Construction laborers $21,060 $70,440$320,660 Truck drivers (all types) $26,232 $92,023$299,077 Customer Service Reps $24,264 $83,812$307,288 Secretaries & Admin Assistants (all types except legal & medical) $24,252$83,763$307,337 Elementary School Teacher $39,876 $148,983$242,117 Secondary School Teacher $44,556 $168,516$222,584 Fire fighters $47,172 $179,440$211,660 Police officers $49,188 $187,857$203,243")
20
Occupation<50% AMI<80% AMI<120% AMI<150% AMI $25,673$41,077$61,615$77,019 Waiters and Waitresses X Cashiers X Retail salespersons X Cooks (all types) X Construction laborers X Truck drivers (all types) X Customer Service Reps X Secretaries & Admin Assistants (all types except legal & medical) X Elementary School Teacher X Secondary School Teacher X Fire fighters X Police officers X
 X Construction laborers X Truck drivers (all types) X Customer Service Reps X Secretaries & Admin Assistants (all types except legal & medical) X Elementary School Teacher X Secondary School Teacher X Fire fighters X Police officers X")
Similar presentations


 2010 7.5%9.5% 20097.8%9.6% Rochester MSA U.S.>")


