Download presentation
Presentation is loading. Please wait.

1
Chapter 5 Central Axis Depth Dose Calculations

2
Definition of Beam Geometry
The accurate delivery of a radiation dose to patient depends on the precise positioning of the patient and radiation source. The geometric parameters linking the source and target (tumor at treatment) are described below (Fig.)
 are described below (Fig.)")
3
SSD and SAD are geometric parameters that can be changed, and the ability to change them leads to two different planning and treatment set-up modalities: Constant SSD technique. Here, the isocenter (the point at which all of the radiation beams cross) of the treatment machine (or simulator) is on the patient’s skin (= nonisocentric technique). Field and dose are defined according to A0.
 of the treatment machine (or simulator) is on the patient’s skin (= nonisocentric technique). Field and dose are defined according to A0.")
4
Constant SAD technique
Constant SAD technique . Here the isocenter of the treatment machine (or simulator) is in the patient (in the tumor) (= isocentric technique; Field and dose are defined according to Ad.
 is in the patient (in the tumor) (= isocentric technique; Field and dose are defined according to Ad.")
5
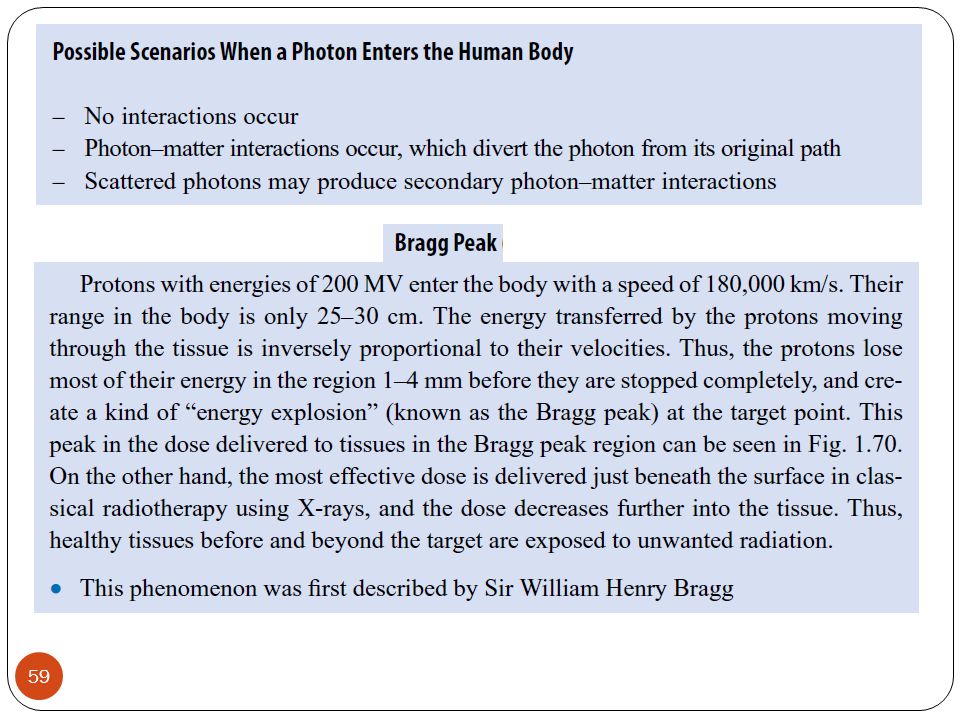
Build-Up Region The region between the skin and the depth at dose maximum (Dmax) is called the build-up region. This region between the surface and depth d is referred to as the dose build-up region in megavoltage beams, and it results from the kinetic energy deposited in the patient by secondary charged particles (which have relatively long ranges) released inside the patient by photon interactions (photoelectric effect, Compton effect, pair production).
 is called the build-up region. This region between the surface and depth d is referred to as the dose build-up region in megavoltage beams, and it results from the kinetic energy deposited in the patient by secondary charged particles (which have relatively long ranges) released inside the patient by photon interactions (photoelectric effect, Compton effect, pair production).")
6
Percentage Depth Dose (PDD)
The ratio (in percent) of the dose absorbed at a predefined depth (Dx) to Dmax (the dose maximum) for a predefined SSD and field size is termed the percentage depth dose (PDD or DD%). DD% is also defined as the dose at a specific depth as a function of distance, field and energy in a water phantom. The percentage depth dose curve provides information on the quality of the radiation and its energy. The depth at dose maximum can be calculated. The most probable energy at the surface of the phantom can be found by calculating the range of the electrons. This can give information on X-ray contamination.
 of the dose absorbed at a predefined depth (Dx) to Dmax (the dose maximum) for a predefined SSD and field size is termed the percentage depth dose (PDD or DD%). DD% is also defined as the dose at a specific depth as a function of distance, field and energy in a water phantom. The percentage depth dose curve provides information on the quality of the radiation and its energy. The depth at dose maximum can be calculated. The most probable energy at the surface of the phantom can be found by calculating the range of the electrons. This can give information on X-ray contamination.")
7
Dose: Energy transferred per unit mass of target tissue, and its unit is Gray (Gy).
The dose in radiotherapy is normalized to the Dmax calculated in the phantom. PDD curves are created by plotting DD% values at different depths from the surface of the phantom.

8
Absorbed dose at any depth: d
One way of characterizing the central axis dose distribution is to normalize dose at depth with respect to dose at a reference depth. The quantity percentage (or simply percent) depth dose may be defined as the quotient, expressed as a percentage, of the absorbed dose at any depth d to the absorbed dose at a fixed reference depth d0, along the central axis of the beam Absorbed dose at any depth: d Absorbed dose at a fixed reference depth: d0 A collimator is a device that narrows a beam of particles or waves. collimator surface phantom D d0 D d d d0
 depth dose may be defined as the quotient, expressed as a percentage, of the absorbed dose at any depth d to the absorbed dose at a fixed reference depth d0, along the central axis of the beam. Absorbed dose at any depth: d. Absorbed dose at a fixed reference depth: d0. A collimator is a device that narrows a beam of particles or waves. collimator. surface. phantom. D d0. D d. d. d0.")
9
Effect of Field Size and Shape
Field size may be specified either geometrically or dosimetrically. The geometric field size is defined as “the projection, on a plane perpendicular to the beam axis, of the distal end of the collimator as seen from the front center of the source”. This definition usually corresponds to the field defined by the light localizer, arranged as if a point source of light were located at the center of the front surface of the radiation source. The dosimetric, or the physical, field size is the distance intercepted by a given isodose curve (usually 50% isodose) on a plane perpendicular to the beam axis at a stated distance from the source. Unless stated otherwise, the term field size in this course will denote geometric field size. In addition, the field size will be defined at a predetermined distance such as the source to surface distance SSD) or the source to axis distance (SAD). The latter term is the distance from the source to axis of gantry rotation known as the isocenter.
 on a plane perpendicular to the beam axis at a stated distance from the source. Unless stated otherwise, the term field size in this course will denote geometric field size. In addition, the field size will be defined at a predetermined distance such as the source to surface distance SSD) or the source to axis distance (SAD). The latter term is the distance from the source to axis of gantry rotation known as the isocenter.")
10
Geometrical field size Dosimetrical or physical field size
Geometrical field size: the projection, on a plane perpendicular to the beam axis, of the distal end of the collimator as seen from the front center of the source Dosimetric ( Physical ) field size: the distance intercepted by a given isodose curve (usually 50% isodose ) on a plane perpendicular to the beam axis Geometrical field size Dosimetrical or physical field size pertaining to zones that receive equal doses of radiation SAD FS
 field size: the distance intercepted by a given isodose curve (usually 50% isodose ) on a plane perpendicular to the beam axis. Geometrical field size. Dosimetrical or physical field size. pertaining to zones that receive equal doses of radiation. SAD. FS.")
11
Isodose Curves Isodose curves are prepared by combining the points in the phantom or target tissue that receive the same dose. They are calculated by various dosimetric measurements, and the highest dose is considered 100%. The curves are placed in percentage order, and then used to create the dose distribution graphics for the target tissue and the energy of interest (Fig. 1.55). By the using the isodose curves during treatment planning, the dose distribution of the radiation delivered to the target tissue and neighboring structures can be seen from different angles. In a plot of isodose curves, the y-axis shows the depth below the surface of the skin, while the x-axis shows the range of the field.
. By the using the isodose curves during treatment planning, the dose distribution of the radiation delivered to the target tissue and neighboring structures can be seen from different angles. In a plot of isodose curves, the y-axis shows the depth below the surface of the skin, while the x-axis shows the range of the field.")
12
Dependence on Source to Surface Distance
Photon fluence emitted by a point source of radiation varies inversely as a square of the distance from the source. Although the clinical source (isotopic source or focal spot) for external beam therapy has a finite size, the source to surface distance is usually chosen to be large (≥80 cm) so that the source dimensions become unimportant in relation to the variation of photon fluence with distance. In other words, the source can be considered as a point at large source to surface distances. Percent depth dose increases with SSD because of the effects of the inverse square law. Although the actual dose rate at a point decreases with an increase in distance from the source, the percent depth dose, which is a relative dose with respect to a reference point, increases with SSD.
 for external beam therapy has a finite size, the source to surface distance is usually chosen to be large (≥80 cm) so that the source dimensions become unimportant in relation to the variation of photon fluence with distance. In other words, the source can be considered as a point at large source to surface distances. Percent depth dose increases with SSD because of the effects of the inverse square law. Although the actual dose rate at a point decreases with an increase in distance from the source, the percent depth dose, which is a relative dose with respect to a reference point, increases with SSD.")
13
In clinical radiation therapy, SSD is a very important parameter
In clinical radiation therapy, SSD is a very important parameter. Because percent depth dose determines how much dose can be delivered at depth relative to the surface dose or Dmax, the SSD needs to be as large as possible. However, because dose rate decreases with distance, the SSD, in practice, is set at a distance that provides a compromise between dose rate and percent depth dose. For the treatment of deep-seated lesions with megavoltage beams, the minimum recommended SSD is 80 cm. Let P (d,r,f) be the percent depth dose at depth d for SSD = f and a field size r (e.g., a square field of dimensions r × r). Since the variation in dose with depth is governed by three effects—inverse square law, exponential attenuation, and scattering. where µ is the linear attenuation coefficient for the primary and Ks is a function that accounts for the change in scattered dose.
 be the percent depth dose at depth d for SSD = f and a field size r (e.g., a square field of dimensions r × r). Since the variation in dose with depth is governed by three effects—inverse square law, exponential attenuation, and scattering. where µ is the linear attenuation coefficient for the primary and Ks is a function that accounts for the change in scattered dose.")
14
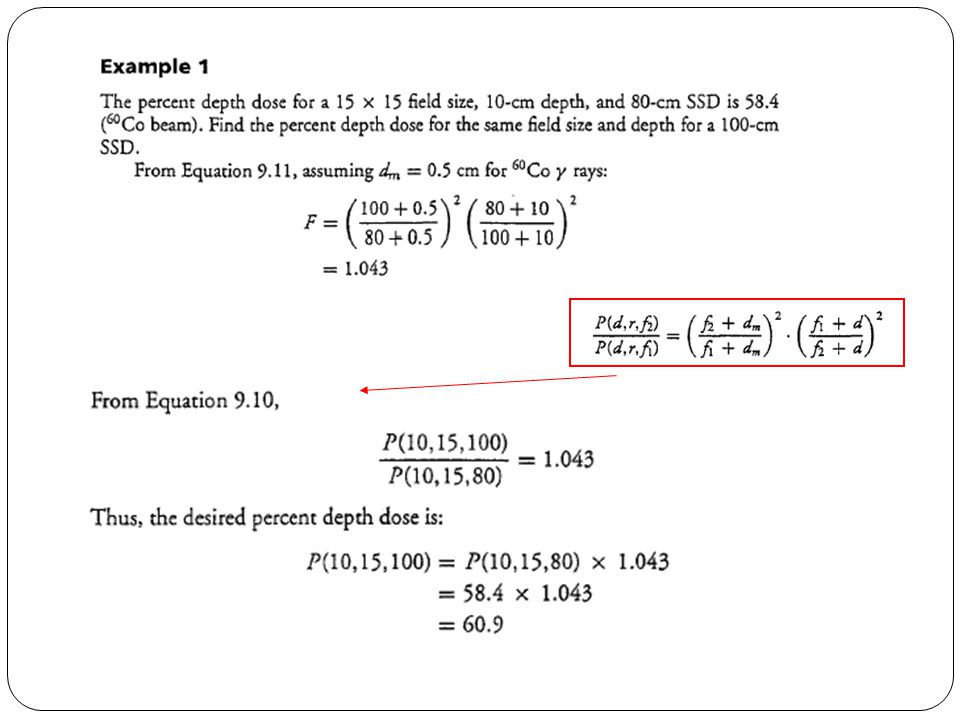
d dm f1 r d dm r f2

15
the Mayneord F Factor ( without considering changes in scattering )
dm f1 r f2 r PDD increases with SSD the Mayneord F Factor ( without considering changes in scattering )
")
18
Dose Profile The characteristics of the delivered radiation can be determined by performing measurements in ionization chamber within a water phantom. These characteristics are the flatness, symmetry, and penumbra for that energy (Fig).
.")
20
General Features of a Water Phantom System
The system can perform three-dimensional computerized controlled analyses of the dose, depth dose, dose ratios [TMR, TPR (measurement and calculation)] and isodose calculations. It has an air scanner capable of making measurements in air, along with an ion chamber, and build-up blocks. There is also a mechanism in these equipments which can be used to mount to the head of actual treatment machines. The system has a specific test apparatus that can be used to test the isocenter point for the treatment machine (an “isocheck”). It has an apparatus that can check the monitor unit controls of a linac teletherapy unit (a “monicheck”). It also has a “linear array” apparatus for dynamic wedge and MLC measurements. Penumbra The penumbra is defined as the region of steep dose rate decrease at the edge of radiation beam, noting that the dose rate decreases as a function of the distance from the central axis
] and isodose calculations. It has an air scanner capable of making measurements in air, along with an ion chamber, and build-up blocks. There is also a mechanism in these equipments which can be used to mount to the head of actual treatment machines. The system has a specific test apparatus that can be used to test the isocenter point for the treatment machine (an isocheck ). It has an apparatus that can check the monitor unit controls of a linac teletherapy unit (a monicheck ). It also has a linear array apparatus for dynamic wedge and MLC measurements. Penumbra. The penumbra is defined as the region of steep dose rate decrease at the edge of radiation beam, noting that the dose rate decreases as a function of the distance from the central axis.")
21
Types of Penumbra The physical penumbra is the penumbra measured in the dose profile. It is the distance between the points at which the 20 and 80% isodose curves cross the x-axis at Dmax. There are several components to the physical penumbra: Geometrical penumbra: This occurs due to the size of the source; large sources have larger geometrical penumbras. Transmission penumbra: This occurs due to the beam emerging from the edges of blocks or collimators. It can be decreased by making sure that the shapes of the focalized blocks take into account the beam divergence.

23
Inverse Square Law This is the decrease in radiation intensity with the square of distance from the source. In tissues, the depth into the tissue thickness is another factor that must be considered in addition to the distance from the source, and the dose decreases exponentially with depth into the tissue. The inverse square law is very important in both radiotherapy and protection from radiation. Since radiotherapy treatments are applied at a short distance from the source, the dose drops off rapidly with distance due to the inverse square law. This situation is observed for both brachytherapy and external radiotherapy. Most external radiotherapy is delivered as teletherapy (at a distance of 80–120 cm). Thus, the dose fall-off due to distance is relatively small. Brachytherapy isodose curves show a rapid dose decrease → rapid fall-off Here, the isodose curves are narrow, so isodose distances are short Teletherapy isodose curves show a slow dose decrease → slow fall-off Here, the isodose curves are wide, so isodose distances are long Isocentric treatment (constant SAD) is affected more by the inverse square law than the SSD technique.
. Thus, the dose fall-off due to distance is relatively small. Brachytherapy isodose curves show a rapid dose decrease → rapid fall-off. Here, the isodose curves are narrow, so isodose distances are short. Teletherapy isodose curves show a slow dose decrease → slow fall-off. Here, the isodose curves are wide, so isodose distances are long. Isocentric treatment (constant SAD) is affected more by the inverse square law than the SSD technique.")
24
Backscatter Factor (BSF)
In a phantom, the ratio of the dose maximum to the dose in air at the same depth is called the backscatter factor (BSF). BSF Increases as the energy increases (gets closer to 1) Increases as the field size increases (gets closer to 1) Is independent of SSD Since the energy of the scattering photon increases as the energy increases, BSF increases. At >2 MV, the BSF approaches 1 The depth at which the BSF is measured depends on the energy The BSF measurement depth at energies below that of Co-60 is the surface, since Dmax is close to the surface
. BSF. Increases as the energy increases (gets closer to 1) Increases as the field size increases (gets closer to 1) Is independent of SSD. Since the energy of the scattering photon increases as the energy increases, BSF increases. At >2 MV, the BSF approaches 1. The depth at which the BSF is measured depends on the energy. The BSF measurement depth at energies below that of Co-60 is the surface, since Dmax is close to the surface.")
25
Tissue to Air Ratio (TAR)
The ratio of the dose at depth d (Dd) in a phantom to the dose at the same depth in air (Dair) for the distance used in SAD is defined as the tissue to air ratio (TAR). The BSF is only defined at Dmax, whereas TAR can be defined at any depth. When d = Dmax, TAR = BSF TAR Increases as the energy increases Increases as the field size increases Is independent of SSD at low megavoltage energies Is dependent on SSD at high megavoltage energies (due to electron contamination) The BSF includes primary radiation and scattered radiation; the TAR only includes scattered and absorbed radiation If Dd = Dmax in the TAR formula → peak scatter factor (PSF).
 in a phantom to the dose at the same depth in air (Dair) for the distance used in SAD is defined as the tissue to air ratio (TAR). The BSF is only defined at Dmax, whereas TAR can be defined at any depth. When d = Dmax, TAR = BSF. TAR. Increases as the energy increases. Increases as the field size increases. Is independent of SSD at low megavoltage energies. Is dependent on SSD at high megavoltage energies (due to electron contamination) The BSF includes primary radiation and scattered radiation; the TAR only includes scattered and absorbed radiation. If Dd = Dmax in the TAR formula → peak scatter factor (PSF).")
26
Tissue Maximum Ratio (TMR)
The ratio of the dose measured at a depth d (Dd) to Dmax in a phantom is defined as the tissue maximum ratio (TMR) : It is defined by performing two measurements in the phantom (i.e., Dd and Dmax are measured). The TMR is normalized to Dmax, in contrast to the TAR. TMR 1. Increases as energy increases 2. Increases as the field size increases 3. Is independent of SSD at low megavoltage energies 4.Is dependent on SSD at high megavoltage energies (due to electron contamination)
 to Dmax in a phantom is defined as the tissue maximum ratio (TMR) : It is defined by performing two measurements in the phantom (i.e., Dd and Dmax are measured). The TMR is normalized to Dmax, in contrast to the TAR. TMR. 1. Increases as energy increases. 2. Increases as the field size increases. 3. Is independent of SSD at low megavoltage energies. 4.Is dependent on SSD at high megavoltage energies (due to electron contamination)")
27
The Differences Between TAR and TMR
1. TAR uses the dose in air 2. TMR uses the dose at Dmax in phantom. 3. TAR is used in isocentric treatment technique. 4. TMR calculation is done instead of TAR at energies more than 3 MV. Scatter Air Ratio (SAR) The ratio of dose measured at d depth (Dd-phantom) in phantom to the dose measured at the same depth in air (Dd-air) is defined as SAR. It is used for the calculation of mean scattered dose. It is independent on SSD as TAR, but dependent parameter on energy, depth, and field size.
 The ratio of dose measured at d depth (Dd-phantom) in phantom to the dose measured at the same depth in air (Dd-air) is defined as SAR. It is used for the calculation of mean scattered dose. It is independent on SSD as TAR, but dependent parameter on energy, depth, and field size.")
28
Collimator Scattering Factor (Sc)
The ratio of the dose measured in any field at a depth d in air to Dmax measured in a reference field (10 × 10 cm2) in air is called the collimator scattering factor (Sc or CSF)
 in air is called the collimator scattering factor (Sc or CSF)")
29
The collimator scattering factor is also termed the output factor.
Sc is measured in an ion chamber with a build-up cap. It is: 1. Correlated with field size 2. Correlated with energy (scattering increases as the field size and energy increase). Phantom Scattering Factor (Sp) The ratio of the dose measured in a definite field size at a depth d to Dmax measured in a reference field (10 × 10 cm2) is defined as the phantom scattering factor (Sp). The ratio of the BSF calculated in any field at a depth d to the BSF in a reference field in a phantom is another way of defining Sp. Sp is important for determining scattered radiation from a phantom.
. Phantom Scattering Factor (Sp) The ratio of the dose measured in a definite field size at a depth d to Dmax measured in a reference field (10 × 10 cm2) is defined as the phantom scattering factor (Sp). The ratio of the BSF calculated in any field at a depth d to the BSF in a reference field in a phantom is another way of defining Sp. Sp is important for determining scattered radiation from a phantom.")
31
Relationship between TAR and Percent Depth Dose
Tissue-air ratio and percent depth dose are interrelated. The relationship can be derived as follows: Considering Figure 9.9A, let TAR(d,rd) be the tissue-air ratio at point Q for a field size rd at depth d. Let r be the field size at the surface, f be the SSD, and dm be the reference depth of maximum dose at point P. Let Dfs (P) and Dfs (Q) be the doses in free space at points P and Q, respectively (Fig. 9.9B,C). Dfs (P) and Dfs (Q) are related by inverse square law:
 be the tissue-air ratio at point Q for a field size rd at depth d. Let r be the field size at the surface, f be the SSD, and dm be the reference depth of maximum dose at point P. Let Dfs (P) and Dfs (Q) be the doses in free space at points P and Q, respectively (Fig. 9.9B,C). Dfs (P) and Dfs (Q) are related by inverse square law:")
33
Conversion of Percent Depth Dose from One SSD to Another—the TAR Method
To convert percent depth dose from one SSD to another the Mayneord F factor, which is derived solely from inverse square law considerations, is used. A more accurate method is based on the interrelationship between percent depth dose and TAR. This TAR method can be derived from Equation 9.23 as follows. Suppose f1 is the SSD for which the percent depth dose is known and f2 is the SSD for which the percent depth dose is to be determined. Let r be the field size at the surface and d be the depth, for both cases. Referring to Figure 9.6, let rd,f1 and rd,f2 be the field sizes projected at depth d in Figure 9.6A and B, respectively:

34
As mentioned earlier, for high-energy x-rays, that is, above 8 MV, the variation of percent depth dose with field size is small and the backscatter is negligible. Equations 9.28 and 9.29 then simplify to a use of Mayneord F factor.

35
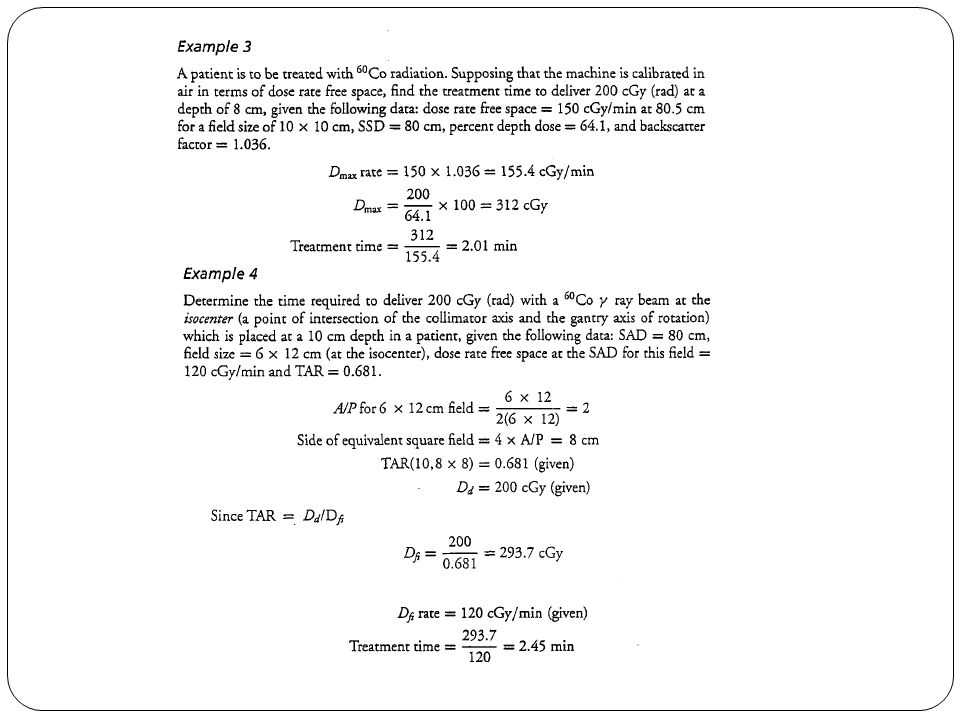
Practical Examples

37
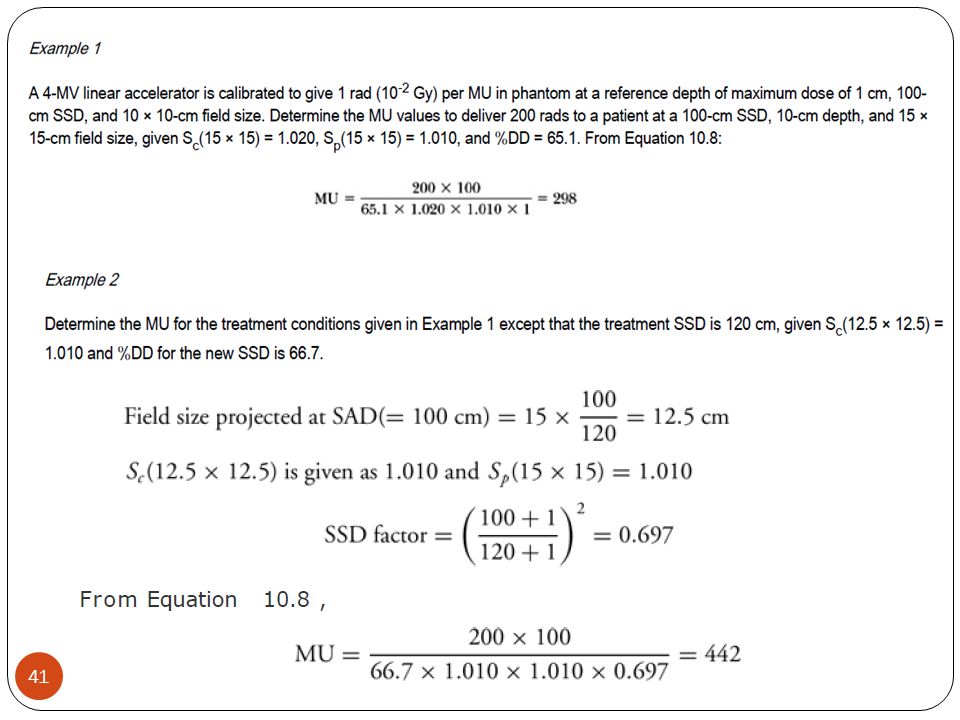
Monitor Unit (MU) Calculation in a Linear Accelerator
Monitor units are the units in which the output of a linac is measured. Linacs are calibrated to give 1 cGy at a SAD distance of 100 cm, for a field size of 10 × 10 cm, and at the depth corresponding to Dmax, and this calibration dose is defined as one monitor unit (MU). Percent depth dose is a suitable quantity for calculations involving SSD techniques. Machines are usually calibrated to deliver 1 rad (10-2 Gy) per monitor unit (MU) at the reference depth t0, for a reference field size 10 × 10 cm and a source to calibration point distance of SCD.
. Percent depth dose is a suitable quantity for calculations involving SSD techniques. Machines are usually calibrated to deliver 1 rad (10-2 Gy) per monitor unit (MU) at the reference depth t0, for a reference field size 10 × 10 cm and a source to calibration point distance of SCD.")
42
TMR is the quantity of choice for dosimetric calculations involving isocentric techniques. Since the unit is calibrated to give 1 rad (10-2 Gy)/MU at the reference depth t0 and calibration distance SCD and for the reference field (10 × 10 cm), then the monitor units necessary to deliver isocenter dose (ID) at depth d are given by:
/MU at the reference depth t0 and calibration distance SCD and for the reference field (10 × 10 cm), then the monitor units necessary to deliver isocenter dose (ID) at depth d are given by:.")
44
Beam Modifiers Bolus Bolus is used for tissue compensation, and is put on the skin at right angles to the beam axis. It is made from a tissue-equivalent density material (Fig.). Bolus use leads to increased effects of radiation scattered into the skin. Thus, the entrance dose to the skin increases. Secondary electrons produced by the bolus also increase the skin dose, since the bolus is in contact with skin (→ the depth corresponding to Dmax gets close to the surface). Compensating Filters The dose distribution is not homogeneous if the surface of the patient is not flat. Therefore, a compensating filter is positioned between the beam source and the skin to reduce the dose delivered to the area with thinner tissue in order to achieve a homogeneous dose distribution in the irradiated volume (Fig.). Compensating filters are made of aluminum–tin or copper–tin mixtures, and are individually designed to compensate for tissue irregularities.
. Bolus use leads to increased effects of radiation scattered into the skin. Thus, the entrance dose to the skin increases. Secondary electrons produced by the bolus also increase the skin dose, since the bolus is in contact with skin (→ the depth corresponding to Dmax gets close to the surface). Compensating Filters. The dose distribution is not homogeneous if the surface of the patient is not flat. Therefore, a compensating filter is positioned between the beam source and the skin to reduce the dose delivered to the area with thinner tissue in order to achieve a homogeneous dose distribution in the irradiated volume (Fig.). Compensating filters are made of aluminum–tin or copper–tin mixtures, and are individually designed to compensate for tissue irregularities.")
47
Wedge Filters Metal wedge filters can be used to even out the isodose surfaces for photon beams delivered onto flat patient surfaces at oblique beam angles (Fig.). These wedges can be static, dynamic or motorized. They are most commonly used in tangential irradiation (e.g., the breast, head and neck regions), and they prevent hot spots in vital organs and cold spots in the radiation field. They provide a more homogeneous dose distribution.
. These wedges can be static, dynamic or motorized. They are most commonly used in tangential irradiation (e.g., the breast, head and neck regions), and they prevent hot spots in vital organs and cold spots in the radiation field. They provide a more homogeneous dose distribution.")
48
Shielding Blocks These are manufactured in order to shield the normal critical structures in radiotherapy portals. There are two types of shielding block. Standard blocks come with the teletherapy unit, and have various sizes and shapes. They are designed according to the area that needs to be protected. On the other hand, focalized blocks are individually made in mold rooms to shield the areas of the field that need protecting (according to the simulation procedure). Standard blocks are only used in emergencies.
. Standard blocks are only used in emergencies.")
49
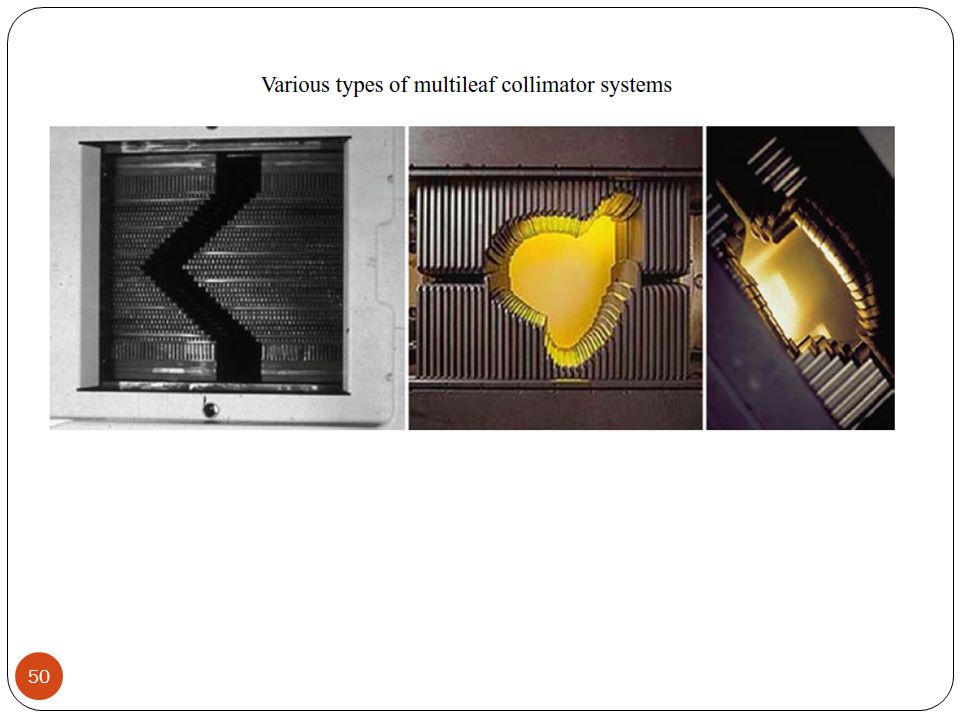
Multileaf Collimator (MLC)
Irregular fields cannot be shaped without focalized blocks in conventional radiotherapy machines. The collimator systems in Co-60 and old linac machines provide only a rectangular field. Multileaf collimators, on the other hand, are composed of many leaves, and each leaf can move independently (Fig.). By arranging these leaves appropriately, irregular fields that a required by the treatment plan can easily obtained without using blocks (Table 1).
. By arranging these leaves appropriately, irregular fields that a required by the treatment plan can easily obtained without using blocks (Table 1).")
61
END OF CHAPTER 5 ANY QUESTIONS

62
Chapter 6 CLINICAL TREATMENT PLANNING IN EXTERNAL PHOTON BEAM RADIOTHERAPY

63
External photon beam radiotherapy is usually carried out with more than one radiation beam in order to achieve a uniform dose distribution inside the target volume and as low as possible a dose in healthy tissues surrounding the target. The ICRU report 50 recommends a target dose uniformity within +7% and –5% of the dose delivered to a well defined prescription point within the target. Modern photon beam radiotherapy is carried out with a variety of beam energies and field sizes under one of two setup conventions: constant source-surface distance (SSD) for all beams or isocentric setup with a constant source-axis distance (SAD). In an SSD setup, the distance from the source to the surface of the patient is kept constant for all beams, while for an SAD setup the center of the target volume is placed at the machine isocenter.
 for all beams or isocentric setup with a constant source-axis distance (SAD). In an SSD setup, the distance from the source to the surface of the patient is kept constant for all beams, while for an SAD setup the center of the target volume is placed at the machine isocenter.")
64
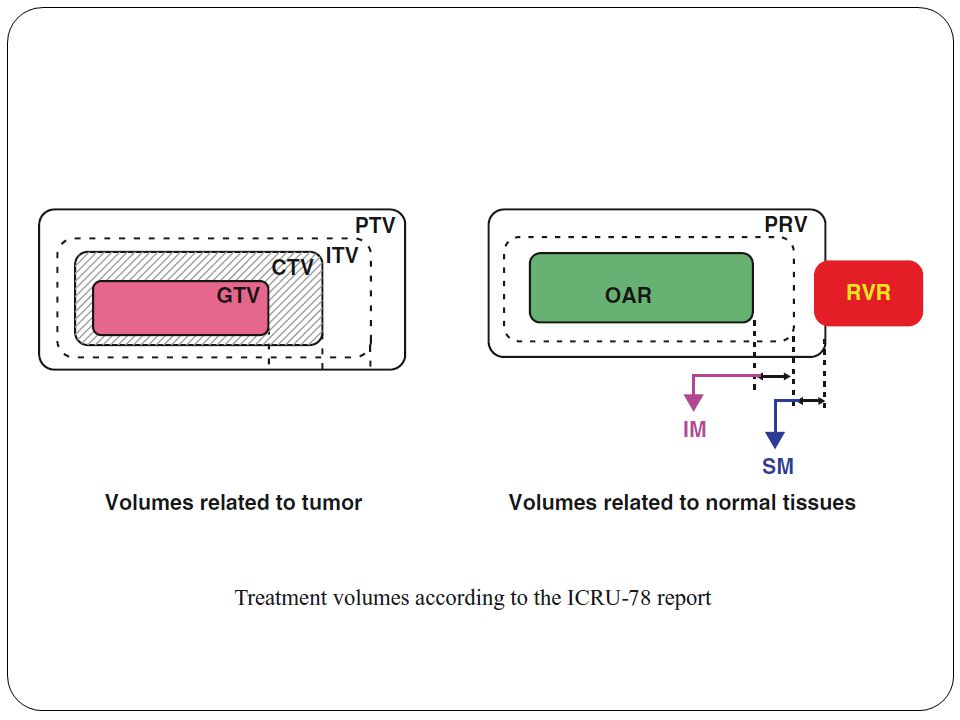
Clinical photon beam energies range from superficial (30 kVp to 80 kVp) through orthovoltage (100 kVp to 300 kVp) to megavoltage energies (Co-60 to 25 MV). Field sizes range from small circular fields used in radiosurgery through standard rectangular and irregular fields to very large fields used for total body irradiations. VOLUME DEFINITION Volume definition is a prerequisite for meaningful 3D treatment planning and for accurate dose reporting. The ICRU 50 and 62 reports define and describe several target and critical structure volumes that aid in the treatment planning process and that provide a basis for comparison of treatment outcomes. The following volumes have been defined as principal volumes related to 3D treatment planning: gross tumour volume, clinical target volume, internal target volume, and planning target volume. Figure shows how the different volumes are related to each other.

65
Gross Tumour Volume (GTV)
Graphical representation of the volumes-of-interest, as defined by the ICRU 50 and 62 reports. Gross Tumour Volume (GTV) “The Gross Tumour Volume (GTV) is the gross palpable or visible/demonstrable extent and location of malignant growth” (ICRU 50). The GTV is usually based on information obtained from a combination of imaging modalities (CT, MRI, ultrasound, etc.), diagnostic modalities (pathology and histological reports, etc.) and clinical examination.
 The Gross Tumour Volume (GTV) is the gross palpable or visible/demonstrable extent and location of malignant growth (ICRU 50). The GTV is usually based on information obtained from a combination of imaging modalities (CT, MRI, ultrasound, etc.), diagnostic modalities (pathology and histological reports, etc.) and clinical examination.")
66
Clinical Target Volume (CTV)
“The clinical target volume (CTV) is the tissue volume that contains a demonstrable GTV and/or sub-clinical microscopic malignant disease, which has to be eliminated. This volume thus has to be treated adequately in order to achieve the aim of therapy, cure or palliation” (ICRU 50). The CTV often includes the area directly surrounding the GTV that may contain microscopic disease and other areas considered to be at risk and require treatment (e.g., positive lymph nodes). The CTV is an anatomical-clinical volume and is usually determined by the radiation oncologist, often after other relevant specialists such as pathologists or radiologists have been consulted.
 is the tissue volume that contains a demonstrable GTV and/or sub-clinical microscopic malignant disease, which has to be eliminated. This volume thus has to be treated adequately in order to achieve the aim of therapy, cure or palliation (ICRU 50). The CTV often includes the area directly surrounding the GTV that may contain microscopic disease and other areas considered to be at risk and require treatment (e.g., positive lymph nodes). The CTV is an anatomical-clinical volume and is usually determined by the radiation oncologist, often after other relevant specialists such as pathologists or radiologists have been consulted.")
67
The CTV is usually stated as a fixed or variable margin around the GTV (e.g., CTV = GTV + 1 cm margin), but in some cases it is the same as GTV (e.g., prostate boost to the gland only). There can be several non-contiguous CTVs that may require different total doses to achieve treatment goals. Internal Target Volume (ITV) Consists of the CTV plus an internal margin. The internal margin is designed to take into account the variations in the size and position of the CTV relative to the patient’s reference frame (usually defined by the bony anatomy), i.e., variations due to organ motions such as breathing, bladder or rectal contents, etc. (ICRU 62). Planning Target Volume (PTV) The planning target volume is a geometrical concept, and it is defined to select appropriate beam arrangements, taking into consideration the net effect of all possible geometrical variations, in order to ensure that the prescribed dose is actually absorbed in the CTV” (ICRU 50). Includes the internal target margin (ICRU 62) and an additional margin for set- up uncertainties, machine tolerances and intra-treatment variations.
 Consists of the CTV plus an internal margin. The internal margin is designed to take into account the variations in the size and position of the CTV relative to the patient’s reference frame (usually defined by the bony anatomy), i.e., variations due to organ motions such as breathing, bladder or rectal contents, etc. (ICRU 62). Planning Target Volume (PTV) The planning target volume is a geometrical concept, and it is defined to select appropriate beam arrangements, taking into consideration the net effect of all possible geometrical variations, in order to ensure that the prescribed dose is actually absorbed in the CTV (ICRU 50). Includes the internal target margin (ICRU 62) and an additional margin for set- up uncertainties, machine tolerances and intra-treatment variations.")
68
The PTV is linked to the reference frame of the treatment machine.
It is often described as the CTV plus a fixed or variable margin (e.g., PTV = CTV + 1 cm). Usually a single PTV is used to encompass one or several CTVs to be targeted by a group of fields. The PTV depends on the precision of such tools as immobilization devices and lasers, but does NOT include a margin for dosimetric characteristics of the radiation beam (i.e., penumbral areas and build-up region) as these will require an additional margin during treatment planning and shielding design. Organ at Risk (OAR) Organ at risk is an organ whose sensitivity to radiation is such that the dose received from a treatment plan may be significant compared to its tolerance, possibly requiring a change in the beam arrangement or a change in the dose. Specific attention should be paid to organs that, although not immediately adjacent to the CTV, have a very low tolerance dose (e.g., eye lens during naso-pharyngeal or brain tumour treatments).
. Usually a single PTV is used to encompass one or several CTVs to be targeted by a group of fields. The PTV depends on the precision of such tools as immobilization devices and lasers, but does NOT include a margin for dosimetric characteristics of the radiation beam (i.e., penumbral areas and build-up region) as these will require an additional margin during treatment planning and shielding design. Organ at Risk (OAR) Organ at risk is an organ whose sensitivity to radiation is such that the dose received from a treatment plan may be significant compared to its tolerance, possibly requiring a change in the beam arrangement or a change in the dose. Specific attention should be paid to organs that, although not immediately adjacent to the CTV, have a very low tolerance dose (e.g., eye lens during naso-pharyngeal or brain tumour treatments).")
69
Organs with a radiation tolerance that depends on the fractionation scheme should be outlined completely to prevent biasing during treatment plan evaluation. DOSE SPECIFICATION A clearly defined prescription or reporting point along with detailed information regarding total dose, fractional dose and total elapsed treatment days allows for proper comparison of outcome results. Several dosimetric end-points have been defined in the ICRU 23 and 50 reports for this purpose: Minimum target dose – from a distribution or a dose-volume histogram (DVH). Maximum target dose – from a distribution or a DVH. Mean target dose – the mean dose of all calculated target points (difficult to obtain without computerized planning). The ICRU reference point dose is located at a point chosen to represent the delivered dose using the following criteria:
. Maximum target dose – from a distribution or a DVH. Mean target dose – the mean dose of all calculated target points (difficult to obtain without computerized planning). The ICRU reference point dose is located at a point chosen to represent the delivered dose using the following criteria:")
70
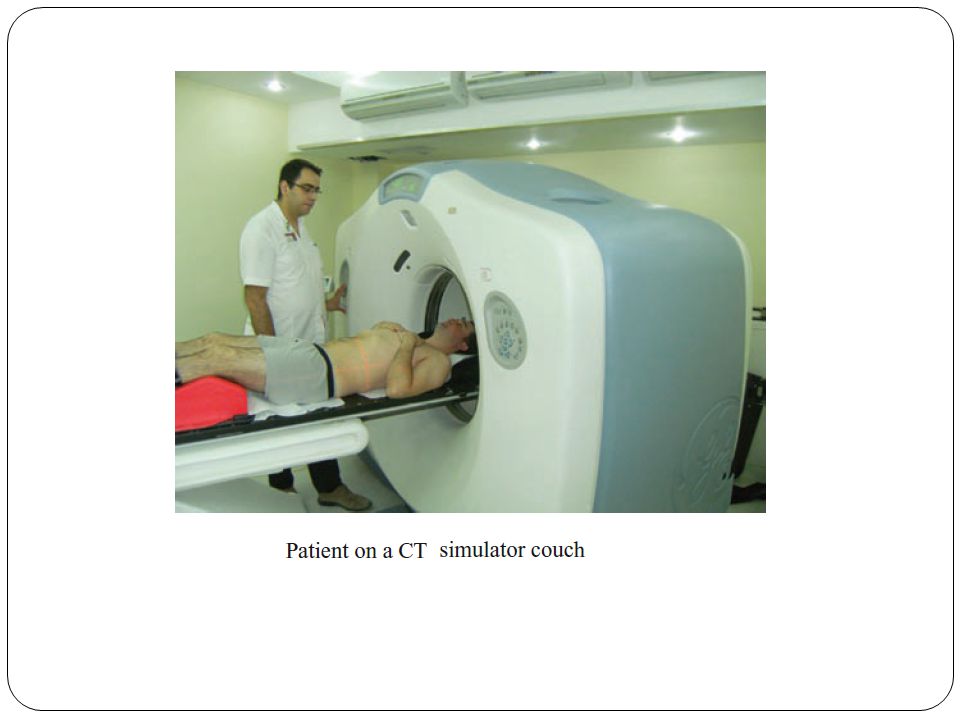
PATIENT DATA ACQUISITION AND SIMULATION Need for patient data
Patient data acquisition is an important part of the simulation process, since reliable data is required for treatment planning purposes and allows for a treatment plan to be properly carried out. The type of gathered data varies greatly depending on the type of treatment plan to be generated (e.g., manual calculation of parallel- opposed beams versus a complex 3D treatment plan with image fusion). General considerations include: Patient dimensions are almost always required for treatment time or monitor unit calculations, whether read with a caliper, from CT slices or by other means. Type of dose evaluation dictates the amount of patient data required (e.g., DVHs require more patient information than point dose calculation of organ dose). Landmarks such as bony or fiducial marks are required to match positions in the treatment plan with positions on the patient.
. General considerations include: Patient dimensions are almost always required for treatment time or monitor unit calculations, whether read with a caliper, from CT slices or by other means. Type of dose evaluation dictates the amount of patient data required (e.g., DVHs require more patient information than point dose calculation of organ dose). Landmarks such as bony or fiducial marks are required to match positions in the treatment plan with positions on the patient.")
71
2D treatment planning A single patient contour, acquired using lead wire or plaster strips, is transcribed onto a sheet of graph paper, with reference points identified. Simulation radiographs are taken for comparison with port films during treatment. For irregular field calculations, points of interest can be identified on a simulation radiograph, and SSDs and depths of interest can be determined at simulation. Organs at risk can be identified and their depths determined on simulator radiographs. 3D treatment planning CT dataset of the region to be treated is required with a suitable slice spacing (typically cm for thorax, 0.5 cm for pelvis, 0.3 cm for head and neck). An external contour (representative of the skin or immobilization mask) must be drawn on every CT slice used for treatment planning. Tumour and target volumes are usually drawn on CT slices by the radiation oncologist.
. An external contour (representative of the skin or immobilization mask) must be drawn on every CT slice used for treatment planning. Tumour and target volumes are usually drawn on CT slices by the radiation oncologist.")
72
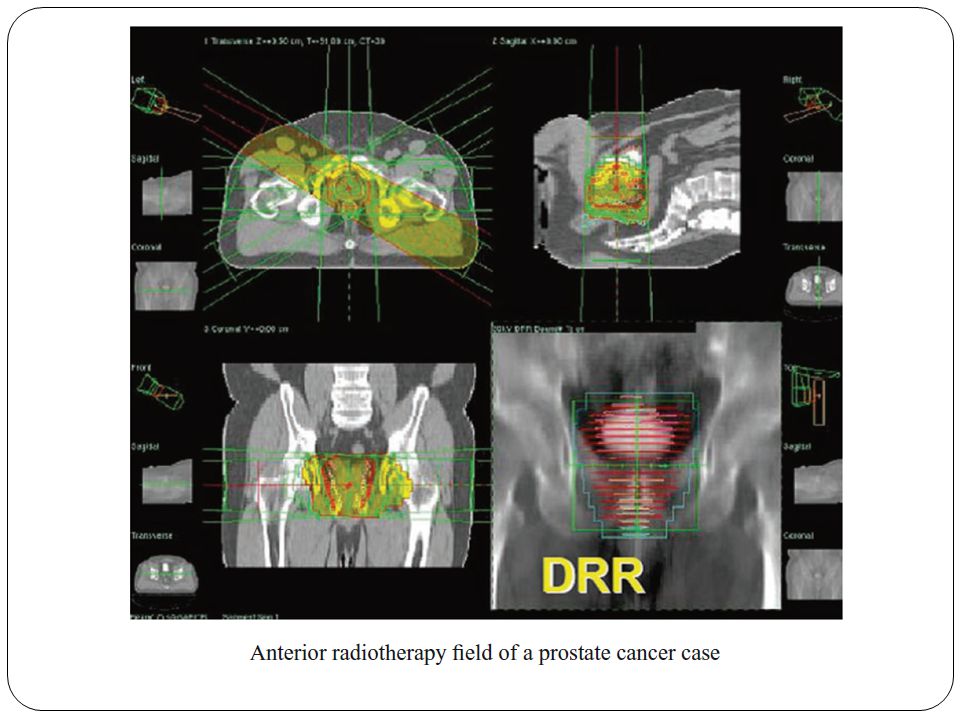
Organs at risk and other structures should be drawn in their entirety, if DVHs are to be calculated.
Fig. shows the typical outlining of target volume and organs at risk for a prostate treatment plan on one CT slice. MRI or other studies are required for image fusion. With many contemporary treatment planning systems, the user can choose to ignore inhomogeneities (often referred to as heterogeneities), perform bulk corrections on outlined organs, or use the CT data itself (with an appropriate conversion to electron density) for point- to-point correction. Simulator radiographs or digitally reconstructed radiographs (DRRs) are used for comparison with portal films.
, perform bulk corrections on outlined organs, or use the CT data itself (with an appropriate conversion to electron density) for point- to-point correction. Simulator radiographs or digitally reconstructed radiographs (DRRs) are used for comparison with portal films.")
73
Treatment simulation Patient simulation was initially developed to ensure that the beams used for treatment were correctly chosen and properly aimed at the intended target. Presently, treatment simulation has a more expanded role in the treatment of patients consisting of: 1)Determination of patient treatment position. 2)Identification of the target volumes and organs at risk. 3) Determination and verification of treatment field geometry. 4)Generation of simulation radiographs for each treatment beam for comparison with treatment port films. 5)Acquisition of patient data for treatment planning.
Determination of patient treatment position. 2)Identification of the target volumes and organs at risk. 3) Determination and verification of treatment field geometry. 4)Generation of simulation radiographs for each treatment beam for comparison with treatment port films. 5)Acquisition of patient data for treatment planning.")
74
The simplest form of simulation involves the use of port films obtained on the treatment machines prior to treatment in order to establish the treatment beam geometry. However, it is neither efficient nor practical to perform simulations on treatment units. Firstly, these machines operate in the megavoltage range of energies and therefore do not provide adequate quality radiographs for a proper treatment simulation, and secondly, there is a heavy demand for the use of these machines for actual patient treatment, so using them for simulation is often considered an inefficient use of resources. There are several reasons for the poor quality of port films obtained on treatment machines, such as: 1) Most photon interactions with biological material in the megavoltage energy range are Compton interactions that are independent of atomic number and that produce scattered photons that reduce contrast and blur the image.
 Most photon interactions with biological material in the megavoltage energy range are Compton interactions that are independent of atomic number and that produce scattered photons that reduce contrast and blur the image.")
75
2) The large size of the radiation source (either focal spot for a linear accelerator or the diameter of radioactive source in an isotope unit) increases the detrimental effects of beam penumbra on the image quality. 3) Patient motion during the relatively long exposures required and the limitations on radiographic technique also contribute to poor image quality. For the above reasons, dedicated equipment for radiotherapy simulation has been developed. Conventional simulation systems are based on treatment unit geometry in conjunction with diagnostic radiography and fluoroscopy systems. Modern simulation systems are based on computed tomography (CT) or magnetic resonance (MR) imagers and are referred to as CT-simulators or MR-simulators. The clinical aspects of treatment simulation, be it with a conventional or CT-simulator rely on the positioning and immobilization of the patient as well as on the data acquisition and beam geometry determination.
 Patient motion during the relatively long exposures required and the limitations on radiographic technique also contribute to poor image quality. For the above reasons, dedicated equipment for radiotherapy simulation has been developed. Conventional simulation systems are based on treatment unit geometry in conjunction with diagnostic radiography and fluoroscopy systems. Modern simulation systems are based on computed tomography (CT) or magnetic resonance (MR) imagers and are referred to as CT-simulators or MR-simulators. The clinical aspects of treatment simulation, be it with a conventional or CT-simulator rely on the positioning and immobilization of the patient as well as on the data acquisition and beam geometry determination.")
76
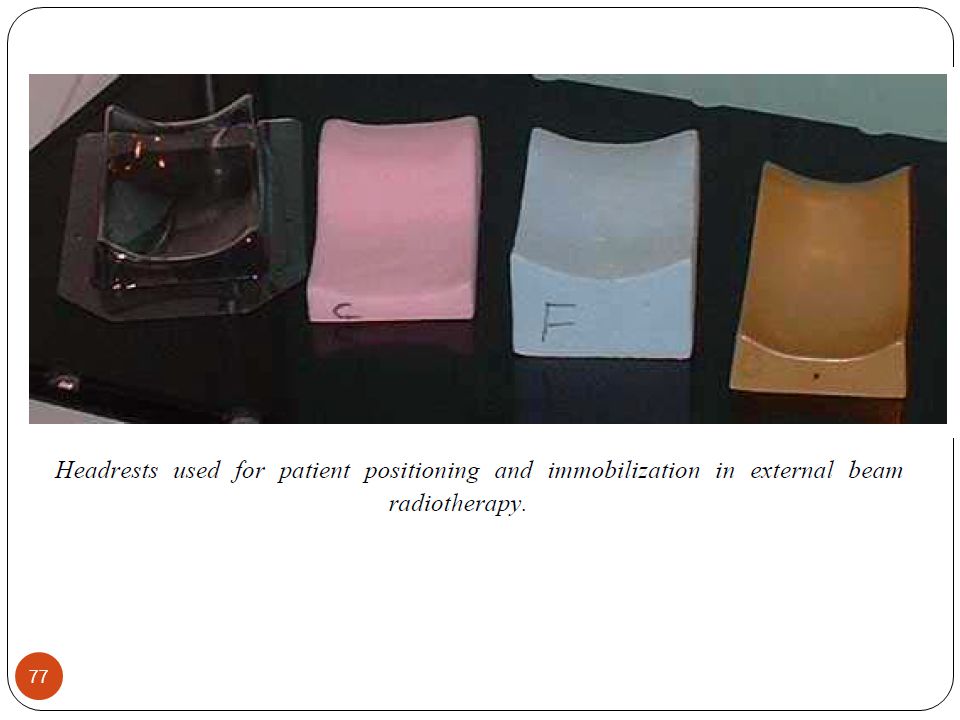
Patient treatment position and immobilization devices
Depending on the patient treatment position or the precision required for beam delivery, patients may or may not require an external immobilisation device for their treatment. Immobilisation devices have two fundamental roles: − To immobilise the patient during treatment. − To provide a reliable means of reproducing the patient position from simulation to treatment, and from one treatment to another. The simplest immobilisation means include masking tape, velcro belts, or elastic bands. The basic immobilisation device used in radiotherapy is the head rest, shaped to fit snugly under the patient’s head and neck area, allowing the patient to lie comfortably on the treatment couch. Figure shows common headrests used for patient comfort and immobilization during treatment.

78
Modern radiotherapy generally requires additional immobilisation accessories during the treatment of patients. Patients to be treated in the head and neck or brain areas are usually immobilised with a plastic mask which, when heated, can be moulded to the patient’s contour. The mask is affixed directly onto the treatment couch or to a plastic plate that lies under the patient thereby preventing movement. A custom immobilization mask is shown in Fig. For treatments to the thoracic or pelvic area, a variety of immobilisation devices are available. Vacuum-based devices are popular because of their reusablility. Basically, a pillow filled with tiny styrofoam balls is placed around the treatment area, a vacuum pump evacuates the pillow leaving the patient’s form as an imprint in the pillow. The result is that the patient can be positioned snugly and precisely in the pillow prior to every treatment. Another system, similar in concept, uses a chemical reaction between reagents in the pillow to form a rigid mould of the patient.

79
Special techniques, such as stereotactic radiosurgery, require such high precision that conventional immobilization techniques are inadequate. In radiosurgery, a stereotactic frame is attached to the patient’s skull by means of screws and is used for target localization, patient setup on the treatment machine, and patient immobilization during the entire treatment procedure. The frame is bolted to the treatment couch thereby providing complete immobilization during the treatment.

80
Patient data requirements
In cases where only the dose along the central axis of the beam is sought (e.g. treatment with a direct field, or parallel and opposed fields, and a flat beam incidence), only the source-surface distance is required, since a simple hand calculation for beam-on time or linac monitor units may suffice. Simple algorithms, such as Clarkson integration, may be used to determine the dosimetric effects of having blocks in the fields, and calculate dose to off-axis points if their coordinates and source to surface distance is measured. Since only point doses are calculated, the patient shape or contour off-axis is not required. For simple computerized 2D treatment planning, the patient’s shape is represented by a single transverse skin contour through the central axis of the beams. This contour may be acquired using lead wire or plaster cast at the time of simulation. The patient data requirements for more sophisticated treatment planning systems
, only the source-surface distance is required, since a simple hand calculation for beam-on time or linac monitor units may suffice. Simple algorithms, such as Clarkson integration, may be used to determine the dosimetric effects of having blocks in the fields, and calculate dose to off-axis points if their coordinates and source to surface distance is measured. Since only point doses are calculated, the patient shape or contour off-axis is not required. For simple computerized 2D treatment planning, the patient’s shape is represented by a single transverse skin contour through the central axis of the beams. This contour may be acquired using lead wire or plaster cast at the time of simulation. The patient data requirements for more sophisticated treatment planning systems.")
81
The patient data requirements for more sophisticated treatment planning systems such as those used in conformal treatment planning are more elaborate than those for 2D treatment planning. They include the following: - The external shape of the patient must be outlined for all areas where the beams enter and exit (for contour corrections) and in the adjacent areas (to account for scattered radiation). - Targets and internal structures must be outlined in order to determine their shape and volume for dose calculation. - Electron densities for each volume element in the dose calculation matrix must be determined if a correction for heterogeneities is to be applied. Attenuation characteristics of each volume element are required for image processing.
 and in the adjacent areas (to account for scattered radiation). - Targets and internal structures must be outlined in order to determine their shape and volume for dose calculation. - Electron densities for each volume element in the dose calculation matrix must be determined if a correction for heterogeneities is to be applied. Attenuation characteristics of each volume element are required for image processing.")
82
Conventional treatment simulation Simulators
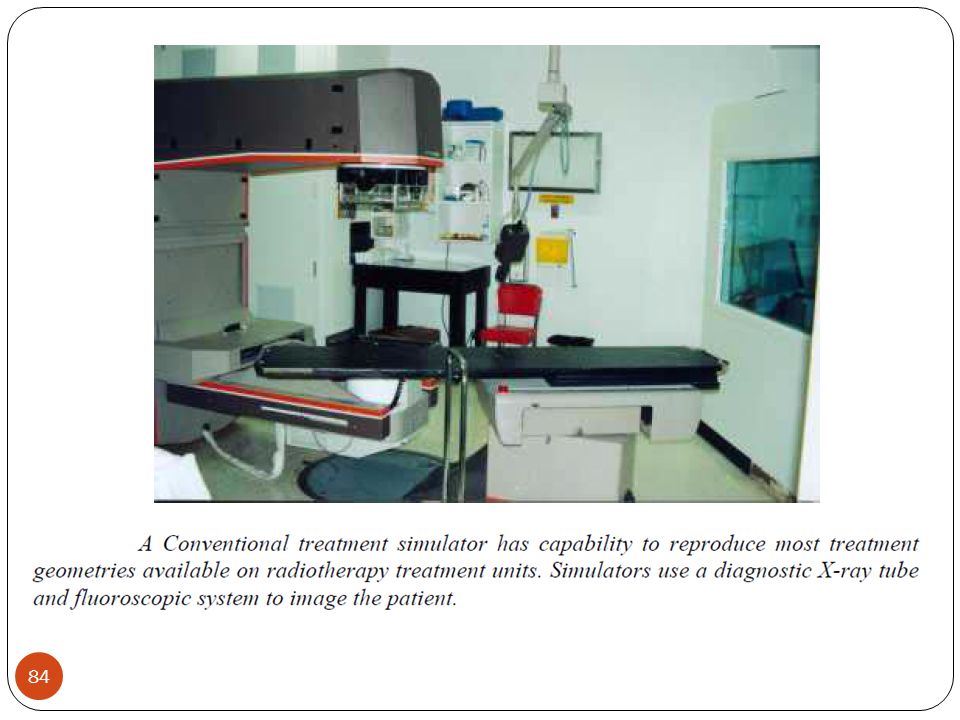
The nature and complexity of data required for sophisticated treatment planning limits the use of manual contour acquisition. At the very best, patient external contour information can be obtained through this method. Transverse CT scans contain all information required for complex treatment planning and form the basis of CT-simulation in modern radiotherapy treatment. Conventional treatment simulation Simulators Simulators provide the ability to mimic most treatment geometries attainable on megavoltage treatment units, and to visualize the resulting treatment fields on radiographs or under fluoroscopic examination of the patient. They consist of a gantry and couch arrangement similar to that found on isocentric megavoltage treatment units, with the exception that the radiation source in a simulator is a diagnostic quality x-ray tube rather than a high-energy linac or a cobalt source. Some simulators have a special attachment that allows them to collect patient cross-sectional information similarly to a CT scanner, hence, the combination is referred to as a simulator-CT.

83
Figure shows a photograph of a conventional treatment simulator.
The photons produced by the x-ray tube are in the kilovoltage range and are preferentially attenuated by higher Z materials such as bone through photoelectric interactions. The result is a high quality diagnostic radiograph with limited soft-tissue contrast, but with excellent visualization of bony landmarks and high Z contrast agents. A fluoroscopic imaging system may also be included and would be used from a remote console to view patient anatomy and to modify beam placement in real time. Localization of target volume and organs at risk For the vast majority of sites, the disease is not visible on the simulator radiographs, therefore the block positions can be determined only with respect to anatomical landmarks visible on the radiographs (usually bony structures or lead wire clinically placed on the surface of the patient).
.")
85
Determination of treatment beam geometry
Typically, the patient is placed on the simulator couch, and the final treatment position of the patient is verified using the fluoroscopic capabilities of the simulator (e.g., patient is straight on the table, etc.). The position of the treatment isocenter, beam geometry (i.e., gantry, couch angles, etc.) and field limits are determined with respect to the anatomical landmarks visible under fluoroscopic conditions. Once the final treatment geometry has been established, radiographs are taken as a matter of record, and are also used to determine shielding requirements for the treatment. Shielding can be drawn directly on the films, which may then be used as the blueprint for the construction of the blocks. A typical simulator radiograph is shown in Fig. Treatment time port films are compared to these radiographs periodically to ensure the correct set up of the patient during the treatments.
. The position of the treatment isocenter, beam geometry (i.e., gantry, couch angles, etc.) and field limits are determined with respect to the anatomical landmarks visible under fluoroscopic conditions. Once the final treatment geometry has been established, radiographs are taken as a matter of record, and are also used to determine shielding requirements for the treatment. Shielding can be drawn directly on the films, which may then be used as the blueprint for the construction of the blocks. A typical simulator radiograph is shown in Fig. Treatment time port films are compared to these radiographs periodically to ensure the correct set up of the patient during the treatments.")
87
Acquisition of patient data
After the proper determination of beam geometry, patient contours may be taken at any plane of interest to be used for treatment planning. Although more sophisticated devices exist, the simplest and most widely available method for obtaining a patient contour is though the use of lead wire. Typically, the wire is placed on a transverse plane parallel to the isocenter plane. The wire is shaped to the patient’s contour, and the shape is then transferred to a sheet of graph paper. Some reference to the room coordinate system must be marked on the contour (e.g., laser position) in order to relate the position of the beam geometry to the patient.
 in order to relate the position of the beam geometry to the patient.")
88
Computed Computed tomography-based conventional treatment simulation
Computed tomography-based patient data acquisition With the growing popularity of computed tomography (CT) in the 1990s, the use of CT scanners in radiotherapy became widespread. Anatomical information on CT scans is presented in the form of transverse slices, which contain anatomical images of very high resolution and contrast, based on the electron density. CT images provide excellent soft tissue contrast allowing for greatly improved tumour localization and definition in comparison to conventional simulation. Patient contours can be obtained easily from the CT data; in particular, the patient’s skin contour, target, and any organs of interest. Electron density information, useful in the calculation of dose inhomogeneities due to the differing composition of human tissues, can also be extracted from the CT dataset.
 in the 1990s, the use of CT scanners in radiotherapy became widespread. Anatomical information on CT scans is presented in the form of transverse slices, which contain anatomical images of very high resolution and contrast, based on the electron density. CT images provide excellent soft tissue contrast allowing for greatly improved tumour localization and definition in comparison to conventional simulation. Patient contours can be obtained easily from the CT data; in particular, the patient’s skin contour, target, and any organs of interest. Electron density information, useful in the calculation of dose inhomogeneities due to the differing composition of human tissues, can also be extracted from the CT dataset.")
89
The target volume and its position are identified with relative ease on each transverse CT slice. The position of each slice and therefore the target can be related to bony anatomical landmarks through the use of scout or pilot images obtained at the time of scanning. Shown in Fig. is a CT slice through a patient’s neck used in CT-based conventional simulation. Pilot or scout films relate CT slice position to anterior-posterior and lateral radiographic views of the patient at the time of scanning (see Fig). They are obtained by keeping the x-ray source in a fixed position and moving the patient (translational motion) through the stationary slit beam. The result is a high definition radiograph which is divergent on the transverse axis, but non-divergent on the longitudinal axis.
. They are obtained by keeping the x-ray source in a fixed position and moving the patient (translational motion) through the stationary slit beam. The result is a high definition radiograph which is divergent on the transverse axis, but non-divergent on the longitudinal axis.")
92
The target position relative to the bony anatomy on the simulator radiographs may then be determined through comparison with the CT scout or pilot films keeping in mind the different magnifications between the simulator films and scout films. This procedure allows for a more accurate determination of tumour extent and therefore more precise field definition at the time of simulation. If the patient is CT scanned in the desired treatment position prior to simulation, the treatment field limits and shielding parameters may be set with respect to the target position, as determined from the CT slices.

93
Determination of treatment beam geometry
The treatment beam geometry, and any shielding required can now be determined indirectly from the CT data. The result is that the treatment port more closely conforms to the target volume, reducing treatment margins around the target and increasing healthy tissue sparing.

125
END OF CHAPTER 6 ANY QUESTIONS

Similar presentations


 RAD 365 CT - Scan>")

