Download presentation
Presentation is loading. Please wait.

1
Key Performance Indicators, Centre Reports, and more Stephen McDonald

2
Barbecue talk

3
More “good” news

4
Indigenous incidence rates

5
Background A number of ongoing work themes exist within ANZDATA for generating output –Stock and flow figures –Annual Report –Contributor requests Responses to information needed for various projects –Research projects (internal and external analyses) –Outcomes reporting
 –Outcomes reporting")
6
Outcomes reporting Recent years have seen a growth of interest in outcomes reporting Centre reports have been part of ANZDATA for many years, with increasing emphasis in recent years –At “parent hospital level” –Limited distribution historically

7
Why measure outcomes?

8
Dialysis outcome

9
Variation in transplant outcomes

10
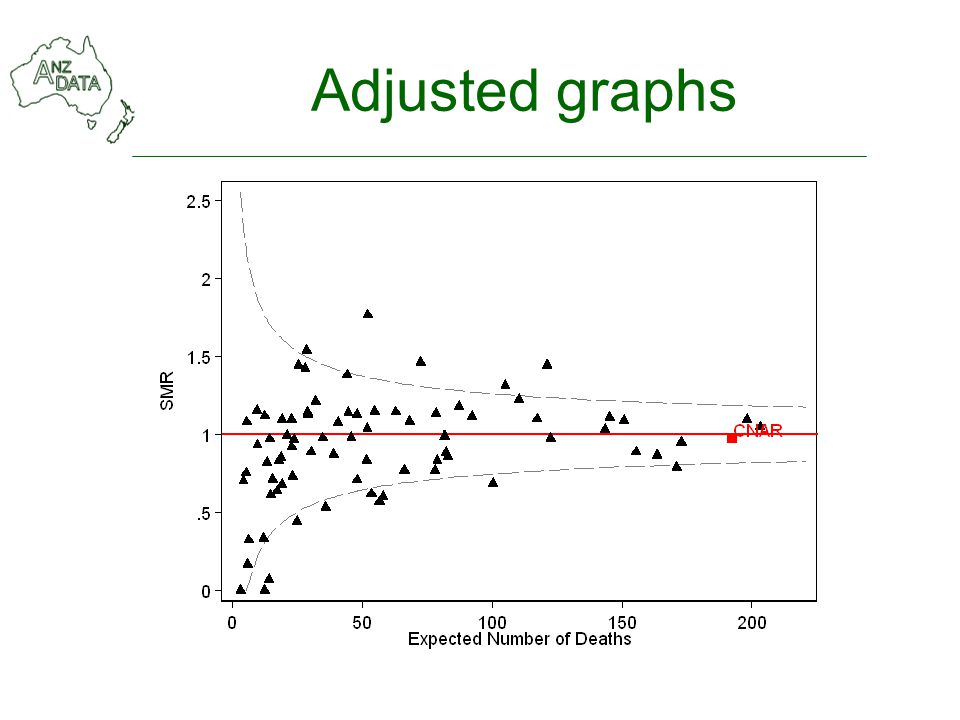
What is happening to centre reports? Greater reporting of demographics and comorbidities Adjusted analyses in transplanting centre and dialysis reports –Details of models supplied Graphs –Funnel plots –CUSUM plots (transplant)
.")
11
Centre reports – graph 1

12
Centre reports – graph 2

13
But....

14
Adjusted graphs

16
How are reports derived?

17
You need a model Logistic regression model (transplant), Poisson model (dialysis) Adjusted for demographics, comorbidities (donor and XM variables) With this model, derive a probability of “expected” failure for each person / graft based on covariate matrix Compare this with actual outcomes www.anzdata.org.au
, Poisson model (dialysis) Adjusted for demographics, comorbidities (donor and XM variables) With this model, derive a probability of expected failure for each person / graft based on covariate matrix Compare this with actual outcomes")
18
Which predictors are important? Predictive power of multivariate Cox model predicting graft survival, all DD transplants 2001-2009, with sequential addition of covariate groups

19
www.anzdata.org.au Factors within the control of centre –These may be why a particular centre gets good or bad results Factors that occur as a result of treatment decisions For example, don’t adjust for –Choice of dialysis modality, HD access –Use of immunosuppressives, rejection, 1 month graft function… Don’t adjust for…

20
Other graphical demonstrations of output Funnel plots are a static measure and summarise performance (relative to a comparator) over a fixed period of time. –Lack a dynamic element –Weight recent and distant results equally

21
Adding time – CUSUM 0 100 200 300 400 Number of tx -4 -2 0 2 4 Cumulative sum O-E 01jan200401jan200501jan200601jan200701jan200801jan2009 Tx date Twoway CUSUM for a transplant centre

22
Removing credit for good deeds

23
Do we need to do more?

24
Why KPIs? Mortality is an insensitive and late indicators of problems –Hopefully rare –Outcome of complex series of events Incompletely ascertained –Important to monitor as best we can Key Process indicators –Simpler to understand, easier to address –Need to be valid and correctable (and related to meaningful outcomes)
.")
25
KPI Project Dialysis KPI project commenced 2011 –At instigation of DNT committee 2 markers chosen – Peritonitis and HD access at first treatment –Deliberately limited to existing data collection NO additional data collected –Based on real time ANZDATA data collection

26
Variation in HD access

27
Variation in peritonitis rate 27

28
KPI reporting -- access Quarterly identified feedback to units

29
Peritonitis reporting

30
Where to from here? COMMUNICATE Improve data collection Improve access to results Enhance reporting –Add peritonitis rates –Access subdivided by late referral –Graphs etc etc Or is it all just too hard?

31
How do we view quality?

33
Centre reports -- SMR

Similar presentations


![If we use a logistic model, we do not have the problem of suggesting risks greater than 1 or less than 0 for some values of X: E[1{outcome = 1} ] = exp(a+bX)/](/11/3248837/big_thumb.jpg "If we use a logistic model, we do not have the problem of suggesting risks greater than 1 or less than 0 for some values of X: E[1{outcome = 1} ] = exp(a+bX)/>")


 Analgaesic nephropathy – the end of an epidemic? (Sean Chang)>")
, and Dan Berlowitz.>")