Download presentation
Presentation is loading. Please wait.

1
The Bohr Model and Electron Dot Diagrams
Science 10

2
The Bohr Model Protons and Neutrons are confined to the nucleus of an atom and can be determined using the atomic number and atomic weight of an atom The electrons orbit the nucleus in shells or energy levels When an energy level is full, any additional electrons will fill the next shell

3
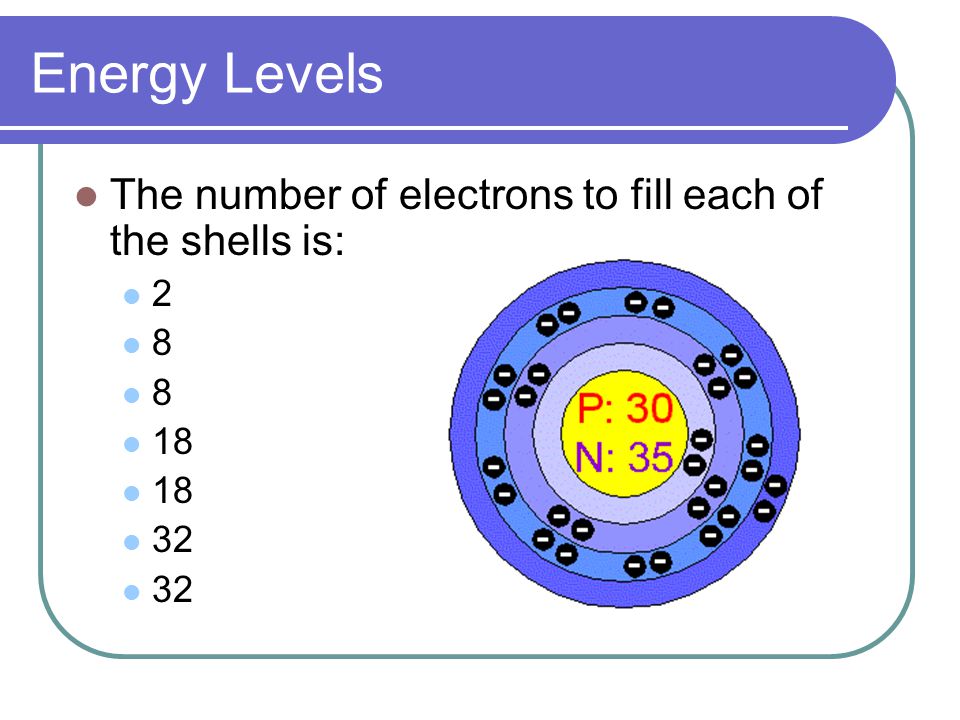
Energy Levels The number of electrons to fill each of the shells is: 2
8 18 32
4
Bohr Model – Potassium 19 protons, 19 electrons, 20 neutrons

5
Bohr Model Choose four different atoms from the periodic table (with at least 3 electron shells) Draw the Bohr Model Diagram for each
 Draw the Bohr Model Diagram for each.")
6
Electron Dot Diagrams When it comes to chemical bonding, we are only interested in the valance electrons so we simplify the Bohr Diagrams into an Electron Dot Diagram This model uses dots to represent the valance electrons and ignores any electrons in the inner shells

7
Be S Electron Dot Diagrams Beryllium Sulphur 4 electrons
2 in the first shell 2 in the valance shell Sulphur 16 electrons 2 in the first shell 8 in the second shell 6 in the valance shell Be S

8
Electron Dot Diagrams Complete Electron Dot Diagrams for the first 20 elements

Similar presentations


 model of an atom>")


 Orbital Energy Levels Bohr Model Diagrams.>")


