Download presentation
Presentation is loading. Please wait.

1
A PBIS Quick Refresher: Team Initiated Problem Solving
Jim Drown and Richard Boltax From the work of: Rob Horner, Steve Newton, & Anne Todd, University of Oregon Bob Algozzine & Kate Algozzine, University of North Carolina at Charlotte Coaches Conference Feb 3, 2010 Oregon State University This session provides a model and some strategies for teams to use as they use SWIS data for problem-solving and decision making. The TIPS model (team initiated problem solving) is a model that has been built as a result of a federal IES grant charged with figuring out how to teach and coach teams when using SWIS data. The project is a collaboration between UO (Horner, Newton, Todd) and UNC at Charlotte (Algozzine’s) Something to remember: The word ‘data’ is plural. Say ‘data are’
 is a model that has been built as a result of a federal IES grant charged with figuring out how to teach and coach teams when using SWIS data. The project is a collaboration between UO (Horner, Newton, Todd) and UNC at Charlotte (Algozzine’s) Something to remember: The word ‘data’ is plural. Say ‘data are’")
2
Laying the foundation for School-wide PBiS
What is PBiS? Review readiness checklist and some strategies for getting 100% completion of this by First Steps to Implementation. Laying the foundation for School-wide PBiS 2

3
It’s about what we as adults will do differently!
What it is all about! A framework that focuses on changing environmental factors instead of fixing the person. It’s about what we as adults will do differently! 3

4
When a student Doesn’t know how to read – what do we do?
WE TEACH. Doesn’t know how to add – what do we do? Doesn’t know how to swim – what do we do? Doesn’t know how to drive – what do we do? When a student doesn’t know how to behave – What do we do? what can we do? 4

5
PBIS School Team Pop Quiz!
Test your PBIS knowledge and skills

6
Question 1: What does a school need to do to be “ready” and why is it important?

7
Question 2: What is the relationship between behavior and academic success?

8
Question 3: Describe three things you would see or hear in a PBIS School.

9
Question 4: What would you say to people in your school who are reluctant to give tangible rewards/acknowledgements?

10
Question 5: Why is data important in a PBIS School?
What information (data) is used to make decisions.
 is used to make decisions.")
11
The Big Picture: Your Journey through PBS

12
Universal Learn about PBS Attend Prerequisite Trainings
Establish Readiness Complete baseline SET & EBS Develop PBS Implementation Plan Purpose Statement 3-5 Expectations System for Teaching Expectations System for Acknowledging Expectations System for Discouraging Problem Behavior Data-based Decision Making Meet Monthly as a PBS Leadership Team Complete Post Implementation SET Universal

13
Targeted Implement Universal with Fidelity SET Evaluation at 80/80
Establish Targeted Team and Identify Targeted Coordinator Learn about PBS Targeted Level Inventory Existing Targeted Practices Develop Check-in/Check-out Introduce Function-Based Practices Develop Data System to Support Targeted Interventions Targeted

14
Intensive Establish Intensive Team and Indentify Intensive Coordinator
Learn about the Intensive Level of PBS Develop Capacity to Complete FBA and BSP Develop Capacity for Wraparound Supports Intensive

15
Integrated Continuum of Support for ALL
Universal Targeted Intensive NOTICE GREEN GOES IS FOR “ALL” 15

16
Responsiveness to Intervention
Etc. Literacy & Writing Numeracy & Sciences SWPBS Specials Social Sciences 16

17
Problem-Solving Meeting Foundations
Structure of meetings lays foundation for efficiency & effectiveness

18
Problem Solving Meeting Foundations
Team Initiated Problem Solving (TIPS) Model Review Status and Identify Problems Develop and Refine Hypotheses Evaluate and Revise Action Plan Collect and Use Data Discuss and Select Solutions The outer circle ( Problem Solving Meeting Foundations) refer to the process and procedures and team uses to function. Roles are determined and defined, meetings are scheduled for the year, electronic equipment and internet access are available, and an agenda is established. The inner circles and arrows define a problem-solving model designed to improve the decision-making and problem solving of PBIS Team. This model is called “TIPS,” which stands for “Team-Initiated Problem Solving.” The model uses data for during problem solving and decision making, during meetings. We will also apply a metric for determining if rates of problem behavior at a school or below, at, or above the national average to determine if there is a problem or not. TIPS teaches teams to use their SWIS data to define precision problem statements. Once the problem statement is precise, a variety of solutions are discussed based on prevention, teaching, reward, correction and extinction and teams will determine which solution(s) they want to implement. The TIPS model then moves the team to action planning ,evaluation and measurement determination. We are finding it more difficult to use these skills in the REAL context, the purpose of this session is to build the skills and build the fluency of using those skills. Develop and Implement Action Plan Problem Solving Meeting Foundations
 Model. Review. Status and. Identify. Problems. Develop and. Refine. Hypotheses. Evaluate and. Revise. Action Plan. Collect. and Use. Data. Discuss and. Select. Solutions. The outer circle ( Problem Solving Meeting Foundations) refer to the process and procedures and team uses to function. Roles are determined and defined, meetings are scheduled for the year, electronic equipment and internet access are available, and an agenda is established. The inner circles and arrows define a problem-solving model designed to improve the decision-making and problem solving of PBIS Team. This model is called TIPS, which stands for Team-Initiated Problem Solving. The model uses data for during problem solving and decision making, during meetings. We will also apply a metric for determining if rates of problem behavior at a school or below, at, or above the national average to determine if there is a problem or not. TIPS teaches teams to use their SWIS data to define precision problem statements. Once the problem statement is precise, a variety of solutions are discussed based on prevention, teaching, reward, correction and extinction and teams will determine which solution(s) they want to implement. The TIPS model then moves the team to action planning ,evaluation and measurement determination. We are finding it more difficult to use these skills in the REAL context, the purpose of this session is to build the skills and build the fluency of using those skills. Develop and. Implement. Action Plan. Problem Solving Meeting Foundations.")
19
Improving Decision-Making via Problem Solving
Action Planning & Evaluation Problem Solving Problem Solution Steps in the problem solving model. Information/ Data

20
Organizing for an effective problem solving conversation
A key to collective problem solving is to provide a visual context that allows everyone to follow and contribute Problem Use Data Out of Time Solution

21
Define roles for effective meetings
4/19/2017 Define roles for effective meetings Core roles Facilitator Minute taker Data analyst Active team member Administrator Backup for each role Typically NOT the administrator We need primary people with a back up person for each role needed. It is encouraged to NOT have the administrator play a primary role for facilitator, data analyst, or minute taker. Administrators need to be flexible with what might come up and it is unpredictable when a situation causes administrator absence from a planned meeting. Since we know that this might occur, let’s avoid problems and set up the roles so that the team is not dependent on administrators being at the full meetings 100% of the time. Can one person serve multiple roles? Are there other roles needed? 4/19/2017 21 21

22
Meeting Agenda Item: Meeting Foundations Tasks: What, by whom, by when
Any tasks assigned get copied to the meeting minutes of the next meeting as a follow up item Meeting Agenda Item: Meeting Foundations Tasks: What, by whom, by when 4/19/2017 22

23
Activity Complete the Foundations Checklist
For your PBiS leadership team. Thank you

24
PBIS Team Meeting Minutes and Problem-Solving Action Plan Form
Today’s Meeting: Date, time, location: Facilitator: Minute Taker: Data Analyst: Next Meeting: Date, time, location: Facilitator: Minute Taker: Data Analyst: Team Members (bold are present today) Today’s Agenda Items Next Meeting Agenda Items 01. 02. 03. Administrative/General Information and Issues Information for Team, or Issue for Team to Address Discussion/Decision/Task (if applicable) Who? By When? Problem-Solving Action Plan Implementation and Evaluation Precise Problem Statement, based on review of data (What, When, Where, Who, Why) Solution Actions (e.g., Prevent, Teach, Prompt, Reward, Correction, Extinction, Safety) Who? By When? Goal, Timeline, Decision Rule, & Updates This slide is animated to teach the different parts of the meeting minute form each click adds the next section Most schools have the title at the top and write/type as the meeting progresses Make a point that we don’t need to document everything that happened (i.e., NM rolled her eyes KJ entered the room, SW continued to repeat the same issue, we took at 5 minute bathroom break) Our Rating Yes So-So No 1. Was today’s meeting a good use of our time? 2. In general, did we do a good job of tracking whether we’re completing the tasks we agreed on at previous meetings? 3. In general, have we done a good job of actually completing the tasks we agreed on at previous meetings? 4. In general, are the completed tasks having the desired effects on student behavior? Evaluation of Team Meeting (Mark your ratings with an “X”)
 Today’s Agenda Items Next Meeting Agenda Items Administrative/General Information and Issues. Information for Team, or Issue for Team to Address. Discussion/Decision/Task (if applicable) Who By When Problem-Solving Action Plan. Implementation and Evaluation. Precise Problem Statement, based on review of data. (What, When, Where, Who, Why) Solution Actions (e.g., Prevent, Teach, Prompt, Reward, Correction, Extinction, Safety) Who By When Goal, Timeline, Decision Rule, & Updates. This slide is animated to teach the different parts of the meeting minute form each click adds the next section. Most schools have the title at the top and write/type as the meeting progresses. Make a point that we don’t need to document everything that happened (i.e., NM rolled her eyes KJ entered the room, SW continued to repeat the same issue, we took at 5 minute bathroom break) Our Rating. Yes. So-So. No. 1. Was today’s meeting a good use of our time 2. In general, did we do a good job of tracking whether we’re completing the tasks we agreed on at previous meetings 3. In general, have we done a good job of actually completing the tasks we agreed on at previous meetings 4. In general, are the completed tasks having the desired effects on student behavior Evaluation of Team Meeting (Mark your ratings with an X )")
25
Meeting Foundations 4/19/2017
Example of meeting foundation checklist items getting transferred to the meeting minutes for future tracking of completion. 4/19/2017 25 25

26
A completed example… IF a person knows how to use the meeting minute form, the person should be able to pick these minutes up from Jan 7, 2010 and be able to organize previous items to update and facilitate creation of the Feb 3, 2010 agenda

27
Where in the Form would you place:
4/19/2017 Langley Elementary PBIS Team Meeting Minutes and Problem-Solving Action Plan Form Today’s Meeting: Date, time, location: Facilitator: Minute Taker: Data Analyst: Where in the Form would you place: Planning for next PTA meeting? Too many students in the “intensive support” for literacy Schedule for hallway monitoring for next month There have been five fights on playground in last month. Next meeting report on lunch-room status. Next Meeting: Date, time, location: Facilitator: Minute Taker: Data Analyst: Team Members (bold are present today) Today’s Agenda Items Next Meeting Agenda Items 01. 02. 03. Administrative/General Information and Issues Information for Team, or Issue for Team to Address Discussion/Decision/Task (if applicable) Who? By When? Problem-Solving Action Plan Implementation and Evaluation Precise Problem Statement, based on review of data (What, When, Where, Who, Why) Solution Actions (e.g., Prevent, Teach, Prompt, Reward, Correction, Extinction, Safety) Who? By When? Goal, Timeline, Decision Rule, & Updates This slide is animated to teach the different parts of the meeting minute form each click adds the next section Most schools have the title at the top and write/type as the meeting progresses Make a point that we don’t need to document everything that happened (i.e., NM rolled her eyes KJ entered the room, SW continued to repeat the same issue, we took at 5 minute bathroom break) Our Rating Yes So-So No 1. Was today’s meeting a good use of our time? 2. In general, did we do a good job of tracking whether we’re completing the tasks we agreed on at previous meetings? 3. In general, have we done a good job of actually completing the tasks we agreed on at previous meetings? 4. In general, are the completed tasks having the desired effects on student behavior? Evaluation of Team Meeting (Mark your ratings with an “X”) 4/19/2017 27 27
 Today’s Agenda Items Next Meeting Agenda Items Administrative/General Information and Issues. Information for Team, or Issue for Team to Address. Discussion/Decision/Task (if applicable) Who By When Problem-Solving Action Plan. Implementation and Evaluation. Precise Problem Statement, based on review of data. (What, When, Where, Who, Why) Solution Actions (e.g., Prevent, Teach, Prompt, Reward, Correction, Extinction, Safety) Who By When Goal, Timeline, Decision Rule, & Updates. This slide is animated to teach the different parts of the meeting minute form each click adds the next section. Most schools have the title at the top and write/type as the meeting progresses. Make a point that we don’t need to document everything that happened (i.e., NM rolled her eyes KJ entered the room, SW continued to repeat the same issue, we took at 5 minute bathroom break) Our Rating. Yes. So-So. No. 1. Was today’s meeting a good use of our time 2. In general, did we do a good job of tracking whether we’re completing the tasks we agreed on at previous meetings 3. In general, have we done a good job of actually completing the tasks we agreed on at previous meetings 4. In general, are the completed tasks having the desired effects on student behavior Evaluation of Team Meeting (Mark your ratings with an X ) 4/19/")
28
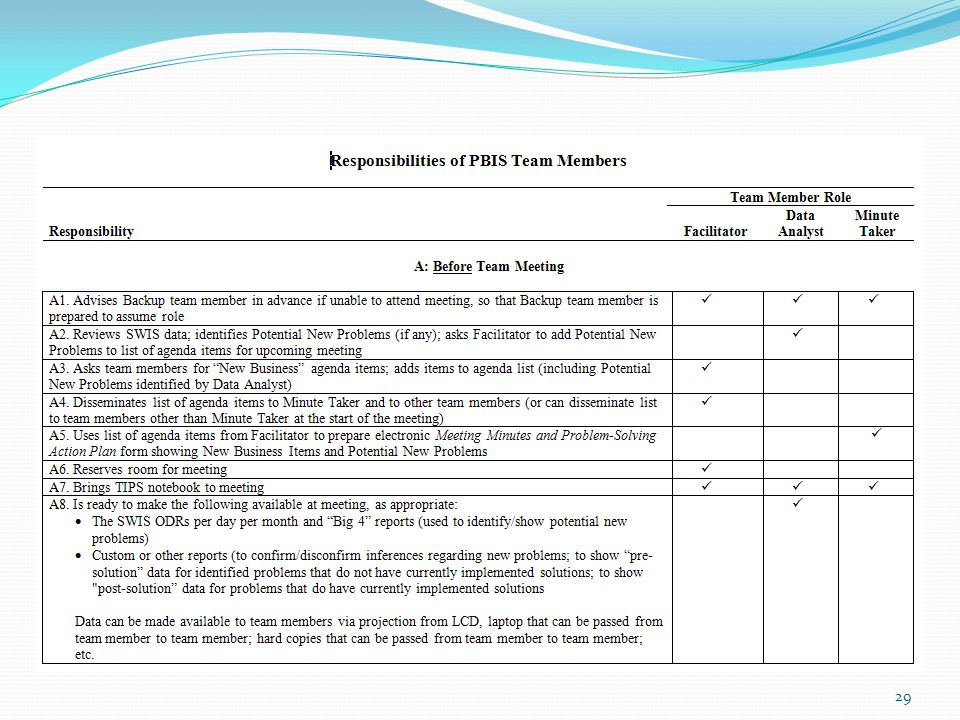
Before the Meeting… Room reserved “New” items solicited for agenda
Agenda produced Team member roles determined Data reviewed by Data Analyst before the meeting; Analyst ready to lead team through discussion of (a) possible new problems and (b) effects of in-process solutions on “old” problems Computer reserved; access to SWIS online database assured LCD projector reserved & set up to project data (or team has some other strategy for ensuring team members can review data at meeting) Team members have individual TIPS Notebooks to bring to meeting (We’ll review the (a) before-meeting, (b) during-meeting, and (c) after-meetings responsibilities of individual team members later in this workshop)
 possible new problems and (b) effects of in-process solutions on old problems. Computer reserved; access to SWIS online database assured. LCD projector reserved & set up to project data (or team has some other strategy for ensuring team members can review data at meeting) Team members have individual TIPS Notebooks to bring to meeting (We’ll review the (a) before-meeting, (b) during-meeting, and (c) after-meetings responsibilities of individual team members later in this workshop)")
31
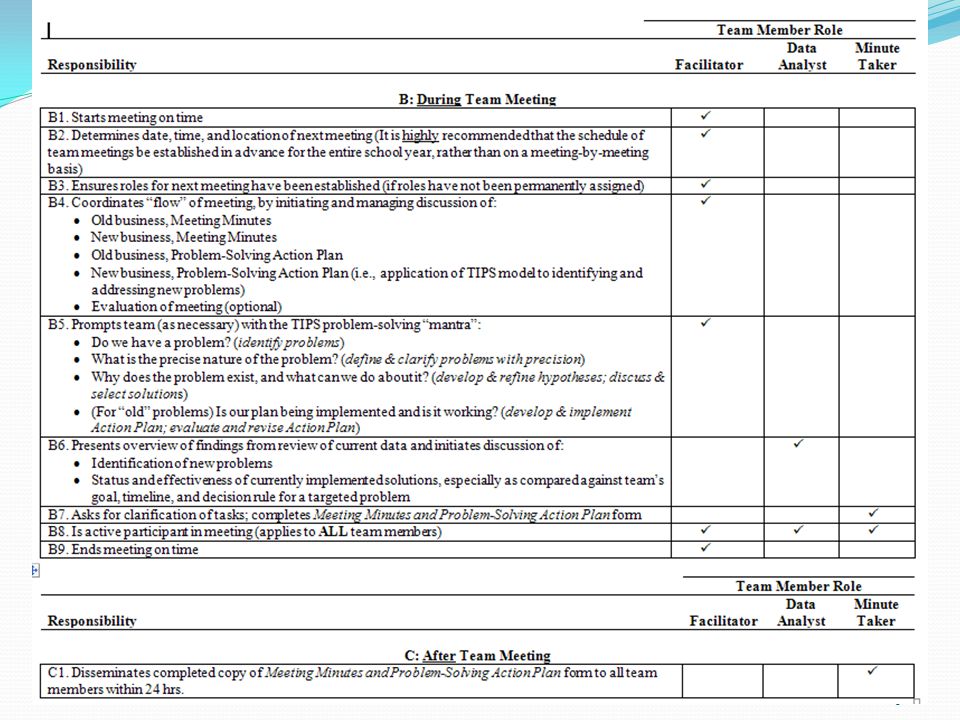
At Close of and After Meeting…
Meeting Minutes and Problem-Solving Action Plan completed Copy of Meeting Minutes & Problem-Solving Action Plan distributed to each member within 24 hrs.

32
Problem Solving Meeting Foundations
Identify Problems Team Initiated Problem Solving (TIPS) Model Develop Hypothesis Evaluate and Revise Action Plan Collect and Use Data Ask participants about knowledge and experience of SWIS Discuss and Select Solutions Develop and Implement Action Plan Problem Solving Meeting Foundations
 Model. Develop. Hypothesis. Evaluate and. Revise. Action Plan. Collect. and Use. Data. Ask participants about knowledge and experience of SWIS. Discuss and. Select. Solutions. Develop and. Implement. Action Plan. Problem Solving Meeting Foundations.")
33
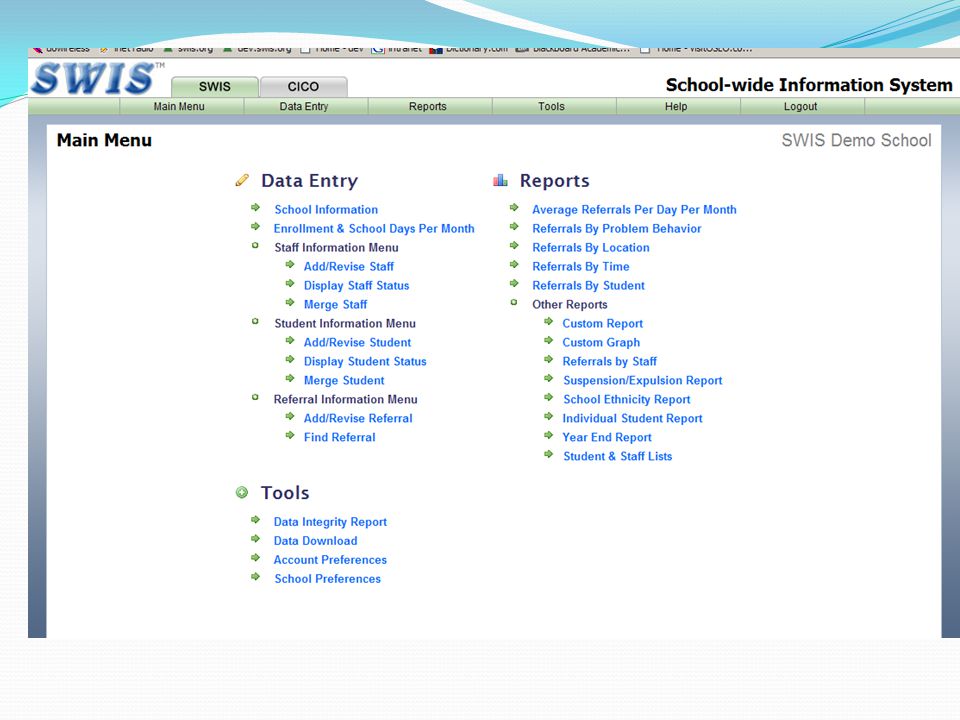
SWISTM (School-Wide Information System)
Defined SWISTM is a web-based information system for gathering, entering, summarizing, reporting and using office discipline referral information Purpose A progress monitoring tool for improving the ability of school personnel to develop safe and effective learning environments

34
Features of SWISTM Only reports discipline data
Major office referrals Minor discipline offences Highly efficient (30 sec per referral) Local control Formatted for decision-making (pictures) Information is available continuously Confidential, secure Can be combined with district data base Teams need access to the data AND a person or two who know how to access and navigate through the data. Ideally, this should happen during a meeting when team members are asking questions about the data. Since SWIS is web-based, it is always available through an internet browser. We need to help people learn how to use the data in an interactive format during a meeting, when the data are most needed. moving the group through the simulations helps to build fluency of the skills needed.
 Local control. Formatted for decision-making (pictures) Information is available continuously. Confidential, secure. Can be combined with district data base. Teams need access to the data AND a person or two who know how to access and navigate through the data. Ideally, this should happen during a meeting when team members are asking questions about the data. Since SWIS is web-based, it is always available through an internet browser. We need to help people learn how to use the data in an interactive format during a meeting, when the data are most needed. moving the group through the simulations helps to build fluency of the skills needed.")
35
How SWISTM works Data Entry School Address and Contact
Enrollment/Ethnicity/Days per month Staff Information Student Information Referrals Reporting Average Referrals per Day per month Referrals by Problem Behavior Referrals by Location Referrals by Time Referrals by Student Other Reports Tools

37
Total Office Discipline Referrals as of January 10
Let’s talk about accuracy of the data again. When you begin to use the data and draw comparisons, the data need to be comparable. Look at the data above. First, as a data analyst, you look and see, ‘wow.. Things are getting better, the graph is going down’…. Then you do what you are supposed to do first, and look at the label on the Y axis. This label says total office discipline referrals. It is great to compare the total ODRs, but now… look at the X-axis. There are a different number of days in each month and the number of schools day in each much has a wide range (Dec may have 10 school days, January may have 19 school days). These months, the way they are arrayed here, are not comparable and this data should not be used! If you aren’t using SWIS, do the math to get average referrals per day per month by using the total referrals and the total days each month. If you are using SWIS, do not fear….. (next slide)
. These months, the way they are arrayed here, are not comparable and this data should not be used! If you aren’t using SWIS, do the math to get average referrals per day per month by using the total referrals and the total days each month. If you are using SWIS, do not fear….. (next slide)")
38
SWIS does that calculation for you. look at the Y-axis label now
SWIS does that calculation for you. look at the Y-axis label now. Average referrals per day per month allow us to compare months. Now look at the trend….. ‘we are going to have a wild spring term if we don’t do anything differently!). This is the same set of data on the previous slide and look at what the pattern of data does for the problem solving process. Accurate data and data that are formatted for purposes of making decisions is critical. I like to make this a bit dramatic by going back and forth between this slide and previous, telling them they are the team and they are reviewing this data…
. This is the same set of data on the previous slide and look at what the pattern of data does for the problem solving process. Accurate data and data that are formatted for purposes of making decisions is critical. I like to make this a bit dramatic by going back and forth between this slide and previous, telling them they are the team and they are reviewing this data…")
39
What behaviors are problematic?

40
What behaviors are problematic?

41
What behaviors are problematic?

42
Where are the problems occurring?

43
Where are the problems occurring?

44
When are the problems occurring?

45
When are the problems occurring?

46
Who is contributing to the problem?

47
Organizing SWIS Data for Decision-making
Universal Screening Tool Proportion of students with 0-1 Office Discipline Referrals (ODRs) 2-5 ODRs 6+ ODRs Progress Monitoring Tool Compare data across time Prevent previous problem patterns Define Problems with precision that lead to solvable problems OK…. Building precision problem statements is a skill that is needed for using the data. organizing and interpreting the data requires another set of skills. Slides provide a sequence of slides to illustrate different precision statements based on different pictures of the same type of data.
 2-5 ODRs. 6+ ODRs. Progress Monitoring Tool. Compare data across time. Prevent previous problem patterns. Define Problems with precision that lead to solvable problems. OK…. Building precision problem statements is a skill that is needed for using the data. organizing and interpreting the data requires another set of skills. Slides provide a sequence of slides to illustrate different precision statements based on different pictures of the same type of data.")
48
Using office discipline referrals as a metric for universal screening of student social behavior
~5% ~15% 0-1 office discipline referral ~80% of Students

49
Identifying problems/issues
What data to monitor ODR per day per month OSS, ISS, Attendance, Teacher report Team Checklist/ SET (are we doing what we planned to do?) What question to answer Do we have a problem? What questions to ask of Level, Trend, Peaks How do our data compare with last year? How do our data compare with national/regional norms? How do our data compare with our preferred/expected status? If a problem is identified, then ask What are the data we need to make a good decision?
 What question to answer. Do we have a problem What questions to ask of Level, Trend, Peaks. How do our data compare with last year How do our data compare with national/regional norms How do our data compare with our preferred/expected status If a problem is identified, then ask. What are the data we need to make a good decision")
50
Solvable Problem Statements (What are the data we need for a decision
Solvable problem statements include information about the five core “W” questions. What is problem, and how often is it happening Where is it happening Who is engaged in the behavior When the problem is most likely Why the problem is sustaining

51
Using ODRs to Identify Problems
Build a picture for the pattern of office referrals in your school. Compare the picture with a national average Compare the picture with previous years Compare the picture with social standards of faculty, families, students. Goal Identify problems empirically Identify problems early Identify problems in a manner that leads to problem solving not just whining

52
Using ODRs to Identify Problems
Build a picture for the pattern of office referrals in your school. Compare the picture with a national average Compare the picture with previous years Compare the picture with social standards of faculty, families, students.

53
Using data to determine when to consider targeted interventions…
53

54
SWIS summary 2008-2009 (Majors Only) 3,410 schools; 1,737,432 students; 1,500,770 ODRs
Grade Range Number of Schools Avg. Enrollment per school National Avg. for Major ODRs per 100 students, per school day K-6 2,162 450 .34 = about 1 Major ODR every 3 school days, or about 34 every 100 days 6-9 602 657 .85 = a little less than 1 Major ODR per school day, or about 85 every 100 days 9-12 215 887 1.27 = more than 1 Major ODR per school day, or about 127 every 100 days K- (8-12) 431 408 1.06 = about 1 Major ODR per school day, or about 106 every 100 days How to use these numbers: Your enrollment (e.g. 400 students or 225 students) Divide by 100 (e.g. 400/100 = 4; 225/100 = 2.25 Multiply by the National Average to get ODR per day (4 X .34 = X .34 = .76)
 = about 1 Major ODR per school day, or about 106 every 100 days. How to use these numbers: Your enrollment (e.g. 400 students or 225 students) Divide by 100 (e.g. 400/100 = 4; 225/100 = Multiply by the National Average to get ODR per day. (4 X .34 = X .34 = .76)")
55
SWIS summary 2008-2009 (Majors Only) 3,410 schools; 1,737,432 students; 1,500,770 ODRs
Grade Range Number of Schools Avg. Enrollment per school National Avg. for Major ODRs per 100 students, per school day K-6 2,162 450 .34 = about 1 Major ODR every 3 school days, or about 34 every 100 days 6-9 602 657 .85 = a little less than 1 Major ODR per school day, or about 85 every 100 days 9-12 215 887 1.27 = more than 1 Major ODR per school day, or about 127 every 100 days K- (8-12) 431 408 1.06 = about 1 Major ODR per school day, or about 106 every 100 days
 = about 1 Major ODR per school day, or about 106 every 100 days.")
56
Compare with National Average
150 / 100 = X = .51 Elementary School with 150 Students

57
Compare with National Average
450 / 100 = X = 1.53 Elementary School with 450 Students

58
Application Activity: Absolute Value
Is there a Problem? Middle School of 625 students? Compare with national average: 625/100 = X .85 = 5.31 Office Discipline Referrals per School Day

59
High School: Compare with National Average
1800 / 100 = X 1.27= 22.86 High School of 1800 students Build the routine when reviewing these slides: How many students? How many hundreds? What is the per 100 rate for your school? How are you doing? Is there a trend, are there peaks, patterns?; what can we anticipate?

60
Identification of Problem (for example...)
Our average Major ODRs per school day per month are higher than national average for a school of our enrollment size Our average ODRs per school day per month are higher this year than for corresponding months of previous year Our average ODRs per school day per month are showing an increasing trend Faculty, parents, and students say our ODR levels are too high

61
More Precision Is Required to Solve the Identified Problem
Define problem by identifying What problem behaviors are involved in ODRs Clarify problem by identifying When ODRs are occurring (time of day) Where ODRs are occurring (location) Who is engaging in problem behaviors that result in ODRs Why are problem behaviors continuing to occur
 Where ODRs are occurring (location) Who is engaging in problem behaviors that result in ODRs. Why are problem behaviors continuing to occur.")
62
Problem Statements Ultimately, you want to write a “problem statement” that precisely specifies the problem you identified The more Ws (what, when, where, who… why) you incorporate into the problem statement, the more precise the problem statement will be The more precise the problem statement, the easier it will be to generate a solution that “fits” the problem
 you incorporate into the problem statement, the more precise the problem statement will be. The more precise the problem statement, the easier it will be to generate a solution that fits the problem.")
63
Which Statement Is More Precise?
1a. Too many ODRs 1b. Total of 22 aggression ODRs on playground last month; twice as many as last year & showing increasing trend this year; occurring during first recess; 15 different students involved; aggression appears to provide peer attention, and resolve unclear playground rules (who gets equipment), 2a. Behavior in cafeteria is uncivil and unsafe. 2b. Verbal threats and gender harassment in the cafeteria are increasing; 80% of events are from 4 students during second lunch; We are unclear what is maintaining these behaviors. 3a. Hallway noise is unbearable. 3b. 4a. The number of ODRs per day has increased by 20% each month since school started. 4b.
, 2a. Behavior in cafeteria is uncivil and unsafe. 2b. Verbal threats and gender harassment in the cafeteria are increasing; 80% of events are from 4 students during second lunch; We are unclear what is maintaining these behaviors. 3a. Hallway noise is unbearable. 3b. 4a. The number of ODRs per day has increased by 20% each month since school started. 4b.")
64
Which Statement Is More Precise?
1a. Too many ODRs 1b. Too many instances of disrespect 2a. Too many ODRs between 1:00pm and 1:30pm 2b. Too many ODRs in the afternoon 3a. Too many ODRs occurring outside the classrooms 3b. Too many ODRs on the playground 4a. 25% of students have at least 2 ODRs 4b. Many students are experiencing ODRs 5a. Too many ODRs on the playground 5b. Total of 12 aggression ODRs on playground last month; twice as many as last year & showing increasing trend this year; occurring during first recess; 8 different students involved; aggression appears to provide peer attention.

65
Use Schoolwide Information System (SWIS) Data to Achieve Precision
Question SWIS Table/Graph What problem behaviors are occurring? Referrals by problem behavior When are problem behaviors occurring? Referrals by time Where are problem behaviors occurring? Referrals by location Who is engaging in problem behaviors? Referrals by student Why do problem behaviors keep happening Referrals by motivation

66
Solutions – Generic Strategies
Prevent – Remove or alter “trigger” for problem behavior Define & Teach – Define behavioral expectations; provide demonstration/instruction in expected behavior (alternative to problem behavior Reward/reinforce – The expected/alternative behavior when it occurs; prompt for it, as necessary Withhold reward/reinforcement – For the problem behavior, if possible (“Extinction”) Use non-rewarding/non-reinforcing corrective consequences – When problem behavior occurs Although not a “solution strategy,” Safety may need to be considered (i.e., procedures that may be required to decrease likelihood of injuries or property damage)
 Use non-rewarding/non-reinforcing corrective consequences – When problem behavior occurs Although not a solution strategy, Safety may need to be considered (i.e., procedures that may be required to decrease likelihood of injuries or property damage)")
67
Trevor Test Middle School
Hypothesis: Prevent “Trigger” Define & Teach Reward/Reinforce Withhold Reward Corrective consequence Other Safety

68
Implementing Solutions
Who is going to do it? When will they do it? Minute Taker writes this information down, facilitator follows up at next meeting on status of implementation

69
Evaluating Solutions Define the goal for solving the problem
What will ‘it’ look like when you say it is not a problem Define how you will know that the solutions were implemented as planned (with fidelity)? How often will you conduct a status review? Define how you will know that the solutions had a positive effect on student achievement, social competence, and/or safety? How often will you monitor student progress?
 How often will you conduct a status review Define how you will know that the solutions had a positive effect on student achievement, social competence, and/or safety How often will you monitor student progress")
70
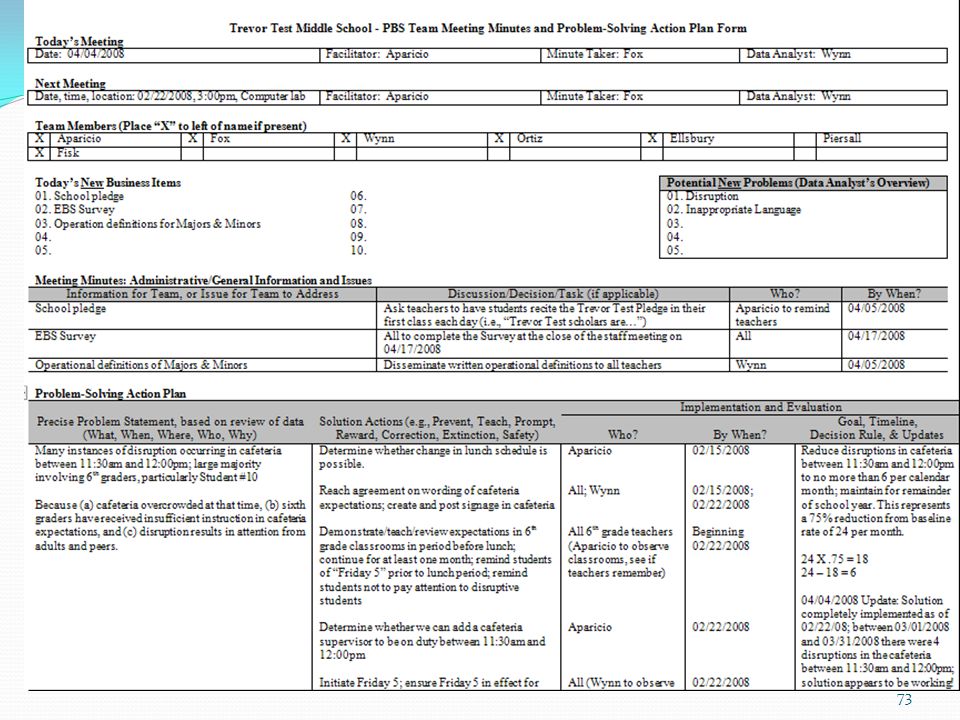
Main problem The sixth graders are disruptive & use inappropriate language in the cafeteria between 11:30 AM and 12:00 PM to get peer attention.

71
Trevor Test Middle School
Hypothesis - cafeteria overcrowded; 6th graders with insufficient instruction in cafeteria expectations; attention from adults and peers rewarding disruption Prevent “Trigger” Change lunch schedule so fewer students are eating between 11:30 AM & 12:00 PM? Define & Teach Focus on 6th graders; define cafeteria expectations; develop and post expectation signage in cafeteria; demonstrate/teach expectations in class periods occurring just prior to lunch Reward/Reinforce Set up “Friday 5” (extra 5 mins. of lunch time on Friday, if no ODRs occur in cafeteria during lunch time) Withhold Reward Ensure staff don’t argue back and forth with student if instance of disruption occurs (may be an inadvertent reward); remind students that paying attention to a disruptive student can mess up Friday 5 Corrective consequence Ensure active supervision during lunch (add one supervisor between 11:30 AM and 12:00 PM?); ensure quick corrective consequence, per our handbook Other Determine whether Behavior Support Program has been initiated for Student #10; if it has, make sure it includes focus on disruption in cafeteria Safety
 Withhold Reward. Ensure staff don’t argue back and forth with student if instance of disruption occurs (may be an inadvertent reward); remind students that paying attention to a disruptive student can mess up Friday 5. Corrective consequence. Ensure active supervision during lunch (add one supervisor between 11:30 AM and 12:00 PM ); ensure quick corrective consequence, per our handbook. Other. Determine whether Behavior Support Program has been initiated for Student #10; if it has, make sure it includes focus on disruption in cafeteria. Safety.")
72
Trevor Test Solution Actions
Choose the solutions that will create an environment that makes the problem irrelevant, inefficient, and ineffective. Choose least amount of work that will have the biggest impact on decreasing the problem. Implementing the solution requires action and time lines Problems need goals so that we can measure progress and know when to move on. Use weekly 1-5 survey of cafeteria monitors to assess implementation of plan Are we doing the plan? 1 ….. 2 …..3 ….. 4 ….. 5 No Yes

74
Solution Development Prevention Teaching Reward Extinction
Corrective Consequence Data Collection

75
Solution Development: For disruption in hall and cafeteria
Prevention *Teach behavioral expectations in cafeteria *Maintain current lunch schedule, but shift classes to balance numbers. Teaching Reward Establish “Friday Five”: Extra 5 min of lunch on Friday for five good days. Extinction Encourage all students to work for “Friday Five”… make reward for problem behavior less likely Corrective Consequence Active supervision, and continued early consequence (ODR) Data Collection Maintain ODR record and supervisor weekly report
 Data Collection. Maintain ODR record and supervisor weekly report.")
76
This is the observation tool used to measure Meeting Foundations and Thoroughness of Problem-Solving for the research studies. DORA does not stand for Dora the Explorer! 76

77
Thanks and… Please spend few minutes sharing your impressions of where your school is at with PBiS and how today’s learning should be used.

Similar presentations


 acknowledges the support of the Wisconsin Department of Public Instruction in the development.>")
 acknowledges the support.>")
