Download presentation
Presentation is loading. Please wait.

1
Climate Change and Water Resources Management WEB pages on water management activities Max Campos Crrhcr@racsa.co.cr San Jose – Costa Rica

2
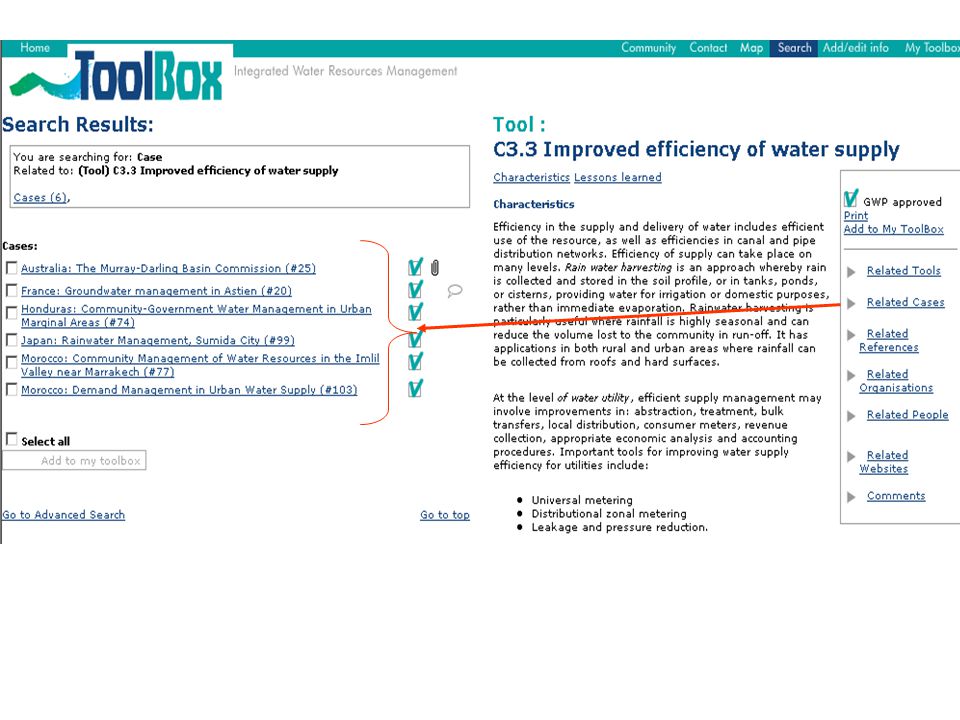
Global Water Partnership (GWP) Toolbox: a summary of case studies around the world about water management. It is being continuously updated.

8
World Water Forum (III WWF) The largest conference of the world on water management, next meeting in Japan march 2003.
 The largest conference of the world on water management, next meeting in Japan march 2003.")
10
Dialogue on Water and Climate Change One of the thematic activities for the IIIer WWF is this Dialogue.

13
Activities from UNESCO World Water Development Report

15
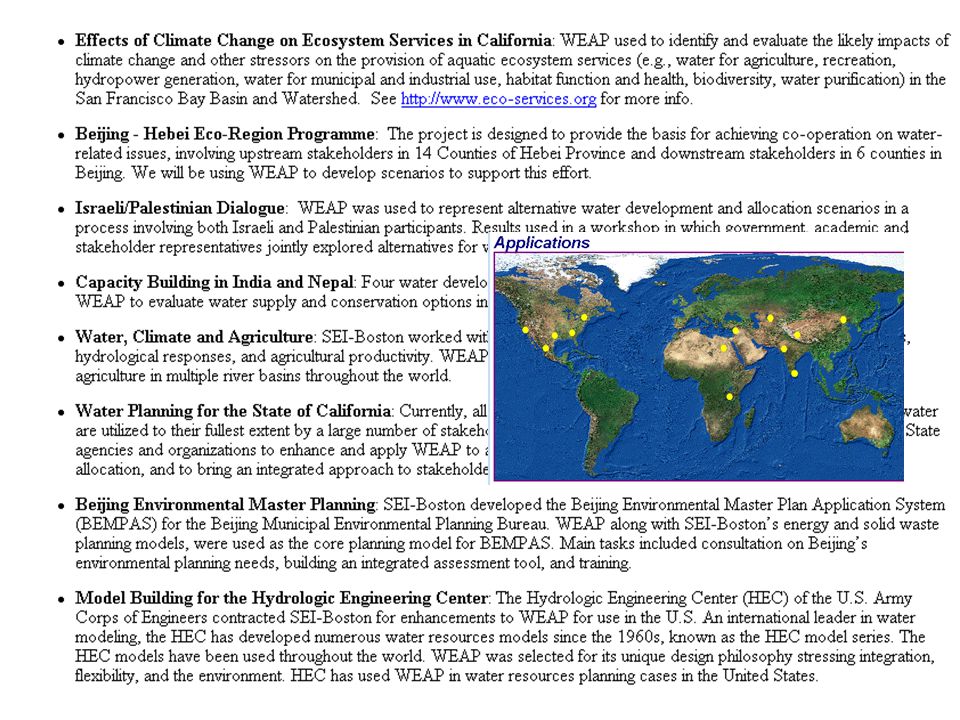
Models for Water Management and Climate Change estimations

18
Download software

20
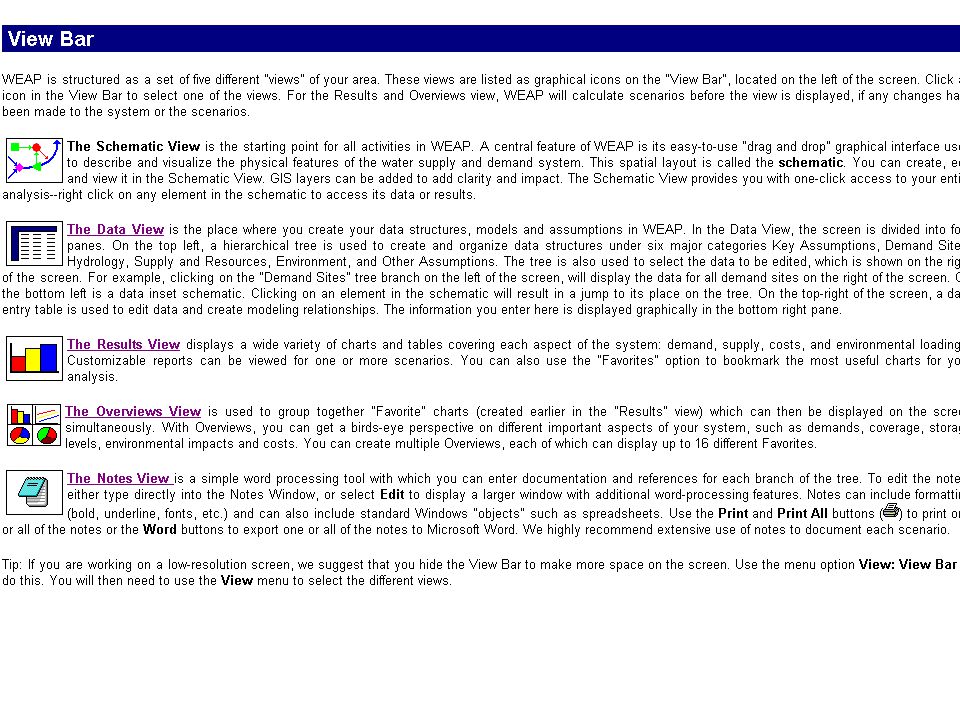
Tree overview Schematic view

25
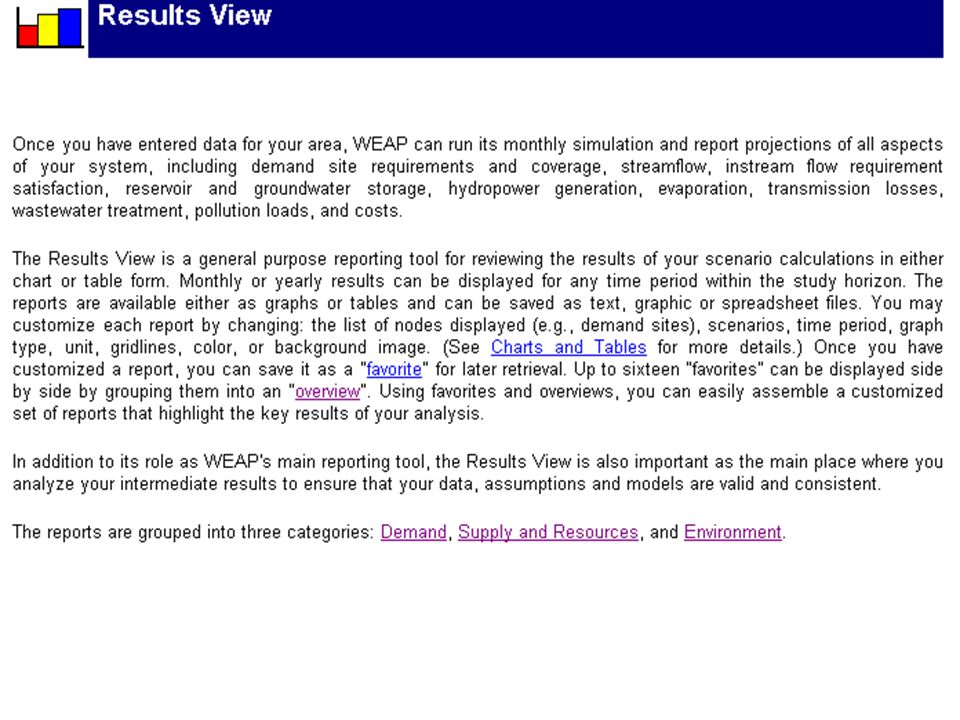
Demand Results Demand results cover requirements by and allocations to demand sites. The following reports are available: Annual Water Demand The annual requirement at each demand site, before distribution losses, reuse and demand-side management savings are taken into account. Monthly Supply Requirement The monthly requirement at each demand site, after distribution losses, reuse and demand-side management savings are taken into account. Supply Delivered The amount of water supplied to demand sites, listed either by source (supplies) or by destination (demand sites). When listed by destination, the amounts reported are the actual amounts reaching the demand sites, after subtracting any transmission losses. Unmet Demand The amount of each demand site's requirement that is not met. When some demand sites are not getting full coverage, this report is useful in understanding the magnitude of the shortage. Coverage The percent of each demand site's requirement (adjusting for distribution losses, reuse and demand-side management savings) that is met, from 0% (no water delivered) to 100% (delivery of full requirement). The coverage report gives a quick assessment of how well demands are being met. Cost of Delivered Water The cost of delivering water to demand sites, listed either by source (supplies) or by destination (demand sites). Demand Site Inflow and Outflow The mass balance of all water entering and leaving one or more demand sites. Inflows (from local and river supplies) are represented as positive amounts, outflows (either consumed or routed to wastewater treatment plants, rivers and local supplies) as negative amounts.
 or by destination (demand sites). When listed by destination, the amounts reported are the actual amounts reaching the demand sites, after subtracting any transmission losses. Unmet Demand The amount of each demand site s requirement that is not met. When some demand sites are not getting full coverage, this report is useful in understanding the magnitude of the shortage. Coverage The percent of each demand site s requirement (adjusting for distribution losses, reuse and demand-side management savings) that is met, from 0% (no water delivered) to 100% (delivery of full requirement). The coverage report gives a quick assessment of how well demands are being met. Cost of Delivered Water The cost of delivering water to demand sites, listed either by source (supplies) or by destination (demand sites). Demand Site Inflow and Outflow The mass balance of all water entering and leaving one or more demand sites. Inflows (from local and river supplies) are represented as positive amounts, outflows (either consumed or routed to wastewater treatment plants, rivers and local supplies) as negative amounts..")
26
Supply and Resources Results Area Inflows: Water entering the area (river headflows, surface water inflows to reaches, groundwater recharge, local reservoir inflows, other local supply inflows). Outflows: Water leaving the area (consumption at demand sites, evaporation on river reaches and reservoirs, losses in transmission links, losses in wastewater treatment, and outflows from the end of rivers and diversions). Note: Inflows to area may not equal total outflows from area due to changes in storage. River Streamflow: The streamflow at selected nodes and reaches along a river. You can plot a line for each point on the river over time (choose Year for the X Axis), or a line for each month plotted along the river (choose River Nodes and Reaches for the X Axis). Flow Requirement Coverage: The percent of each flow requirement that is met, from 0% (no water flowing) to 100% (flow requirement met or exceeded). Groundwater Storage: The aquifer storage levels at the end of each month. Inflows and Outflows: A mass balance of all water entering and leaving a specified aquifer. Inflows (from recharge, inflow from river reaches, and return flows from demand sites and wastewater treatment plants) are represented as positive amounts, outflows (withdrawals by demand sites and outflows to river reaches) as negative amounts. Overflow: Groundwater overflow occurs when the aquifer storage is at its maximum, and there is net inflow. Reservoir Storage: The reservoir storage levels at the end of each month. Inflows and Outflows: All water entering and leaving a specified reservoir. Inflows (either from upstream (river reservoirs) or monthly inflow (local reservoirs) or return flows from demand sites and wastewater treatment plants) are represented as positive amounts, outflows (to downstream, evaporation, or withdrawals by demand sites) as negative amounts. Hydropower: The power generated by reservoirs and hydropower nodes. Transmission Link Inflows and Outflows: Includes amounts lost to evaporation and leakage. Other Local Supply Inflows and Outflows: A mass balance of all water entering and leaving a specified other local supply source. Inflows are represented as positive amounts, outflows as negative amounts. Return Link Inflows and Outflows: Includes amounts lost to evaporation and leakage.
. Note: Inflows to area may not equal total outflows from area due to changes in storage. River Streamflow: The streamflow at selected nodes and reaches along a river. You can plot a line for each point on the river over time (choose Year for the X Axis), or a line for each month plotted along the river (choose River Nodes and Reaches for the X Axis). Flow Requirement Coverage: The percent of each flow requirement that is met, from 0% (no water flowing) to 100% (flow requirement met or exceeded). Groundwater Storage: The aquifer storage levels at the end of each month. Inflows and Outflows: A mass balance of all water entering and leaving a specified aquifer. Inflows (from recharge, inflow from river reaches, and return flows from demand sites and wastewater treatment plants) are represented as positive amounts, outflows (withdrawals by demand sites and outflows to river reaches) as negative amounts. Overflow: Groundwater overflow occurs when the aquifer storage is at its maximum, and there is net inflow. Reservoir Storage: The reservoir storage levels at the end of each month. Inflows and Outflows: All water entering and leaving a specified reservoir. Inflows (either from upstream (river reservoirs) or monthly inflow (local reservoirs) or return flows from demand sites and wastewater treatment plants) are represented as positive amounts, outflows (to downstream, evaporation, or withdrawals by demand sites) as negative amounts. Hydropower: The power generated by reservoirs and hydropower nodes. Transmission Link Inflows and Outflows: Includes amounts lost to evaporation and leakage. Other Local Supply Inflows and Outflows: A mass balance of all water entering and leaving a specified other local supply source. Inflows are represented as positive amounts, outflows as negative amounts. Return Link Inflows and Outflows: Includes amounts lost to evaporation and leakage..")
27
Environment Results Environment results cover pollution generation by demand sites, pollution loads at receptors, and wastewater treatment. Pollution Generation Pollution generated by each demand site. Pollution Loads Pollutant loads carried by return flow links from demand sites and wastewater treatments (sources) into rivers and local supplies (receptors). Pollution Inflow to Treatment Plants Total pollution flowing in to wastewater treatment plants.
 into rivers and local supplies (receptors). Pollution Inflow to Treatment Plants Total pollution flowing in to wastewater treatment plants..")
28
Download software

29
CENTRAL AMERICAN CLIMATE CHANGE PROJECT VULNERABILITY OF THE HYDRIC RESOURCES DUE CLIMATE CHANGE PROJECT CASE: RIO SUCIO BASIN EL SALVADOR CRRH – MAG/DGRNR Ana Daisy Lopez

30
OBJECTIVE EVALUATION OF THE VULNERABILITY OF RIO SUCIO BASIN IN EL SALVADOR, TO THE IMPACT OF CLIMATE CHANGES

31
RIO SUCIO BASIN AREA : 843.0 KM² RIO LEMPA SYSTEM : 8.2 % AREA Q M: 20.7 M3/S (RAINY SEASON) Q M: 6.66 M3/S (DRY SEASON) 300,000 HAB T° MED: 23.8 °C PRECIP: 1688 mm/Year IRRIGATION DISTRICTS: ZAPOTITAN AND ATIOCOYO
 Q M: 6.66 M3/S (DRY SEASON) 300,000 HAB T° MED: 23.8 °C PRECIP: 1688 mm/Year IRRIGATION DISTRICTS: ZAPOTITAN AND ATIOCOYO")
32
BASIN INFORMATION HYDROMETEOROLOGICAL NETWORK –10 METEOROLOGICAL STATIONS –1 HYDROLOGICAL STATION USES: –IRRIGATION, HYDROELECTRICITY –INDUSTRIAL AND WATER SUPPLY METODOLOGY SIMULATION OF THE EFFECTS ON RUNOFF OF CHANGES IN PRECIPITATION AND TEMPERATURE. MODEL USED : CLIRUN 3 CALIBRATION PERIOD 1969-1976 VALIDATION PERIOD 1977-1984

33
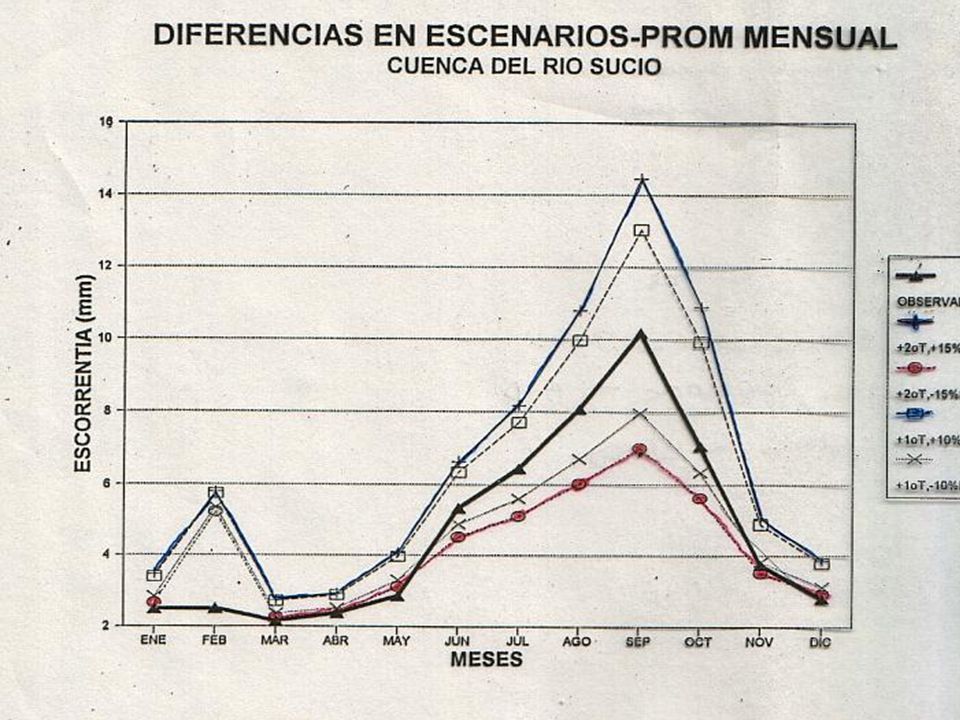
CLIMATE SCENARIOS PACIFIC REGION SCENARIO TEMPERATUREPRECIPITACION 1+ 2 °C + 15 % 2+ 2 °C- 15 % 3+ 1 °C+ 10 % 4+ 1 °C- 15 %

35
CHANGES IN RUNOFF SCENARIOPRECIP (%) TEMP (°C) DRY SEASON WET SEASON 1+ 15%+2+ 34% 2- 15%+2-2 %-20 % 3+10%+1+30 % 4-10%+1-1 %+14 %
 TEMP (°C) DRY SEASON WET SEASON 1+ 15%+2+ 34% 2- 15%+2-2 %-20 % 3+10%+1+30 % 4-10%+1-1 %+14 %")
36
RESULTS MORE CRITICAL SCENARIO: +2 °C AND – 15% DRY SEASON USES COMPROMISED

37
HISTORICAL DISCHARGE DATA

38
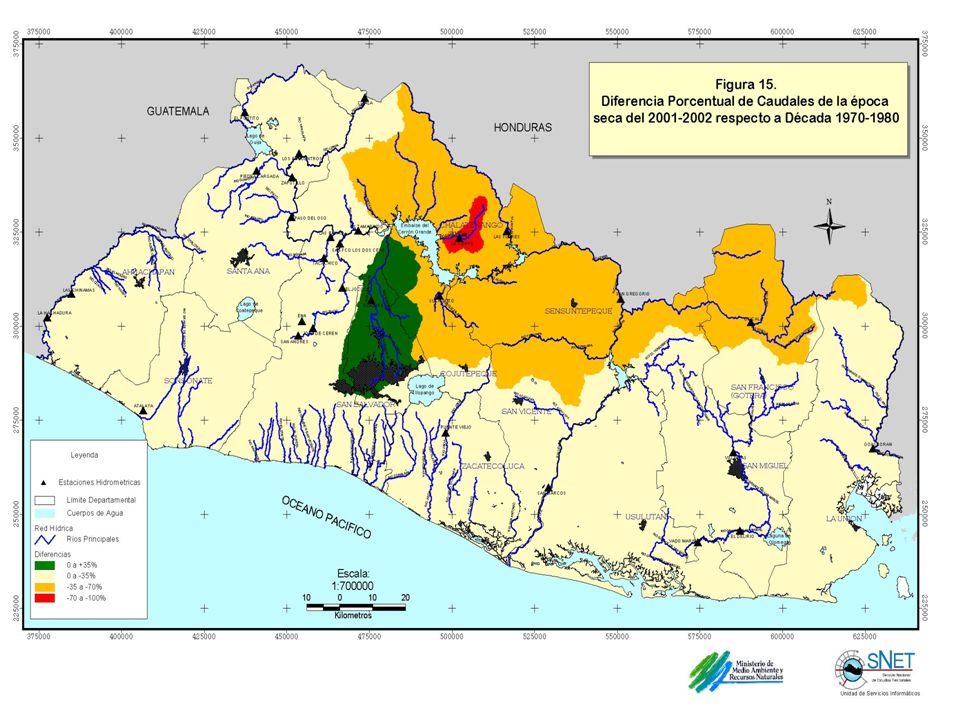
DRY SEASON DECADAL

39
DIFERENCIAS PORCENTUALES DEL PERIODO NOVIEMBRE 2001 - ABRIL 2002 RESPECTO A LA DECADA 1970 - 1980

Similar presentations


>")


>")


