Download presentation
Presentation is loading. Please wait.

2
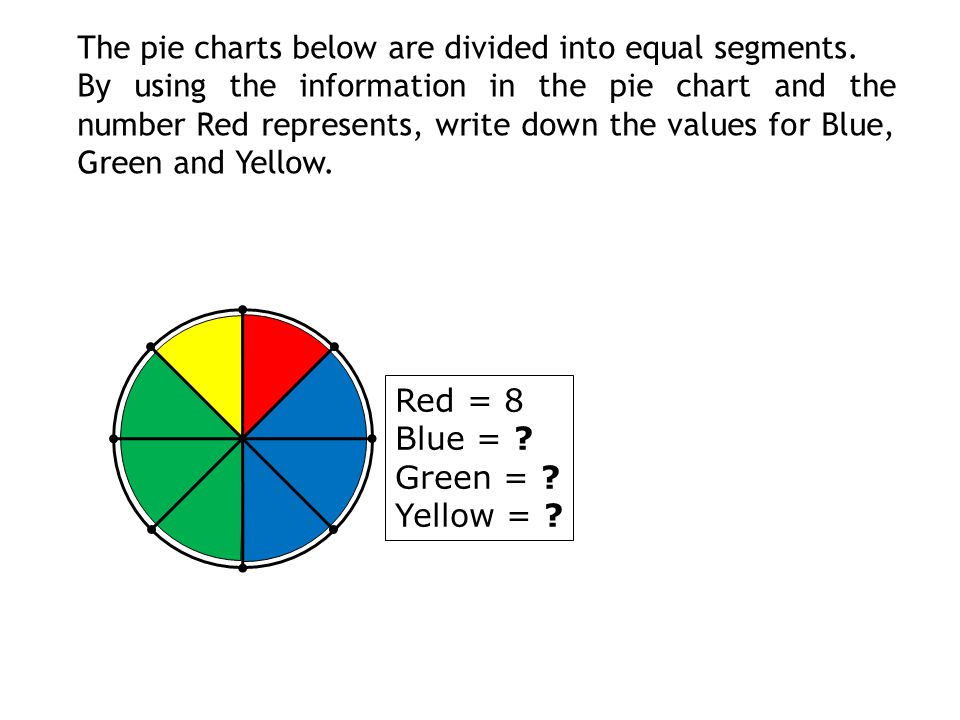
The pie charts below are divided into equal segments. By using the information in the pie chart and the number Red represents, write down the values for Blue, Green and Yellow. Red = 8 Blue = ? Green = ? Yellow = ?

3
Red = 12 Blue = ? Green = ? Yellow = ? Red = 4 x Blue = ? Green = ? Yellow = ?

4
Interpreting Pie Charts Pie charts can be thought of as circle graphs. To calculate the quantities represented by each slice of the pie chart we need to take the angular fraction of the given total. Tea Coffee Cola Squash Milk Chocolate 108 o 84 o 60 o 48 o 36 o 24 o 360 o A drinks machine dispenses 540 drinks on a Monday. The information is displayed in the pie chart. Use the information to find the number of each drink sold.

5
75 90 45 60 30 Total300 Rugby Football Cricket Ice Hockey Favourite Sport Squash 90 o 108 o 54 o 72 o 36 o Interpreting Pie Charts In a survey, 300 people were asked to indicate which one of five sports they liked best. The information is displayed in the pie chart. Calculate the number of people who chose each sport. Rugby Football Cricket Ice Hockey Squash

6
46 16 22 26 34 Total144 Interpreting Pie Charts The information in the pie chart shows the sales of 144 packets of crisps from a shop. Calculate the number of each type sold. Plain Chicken Salt & V Cheese & On Crisp Sales Smokey Bacon Plain Chicken Salt & V Cheese & On Smokey Bacon 115 o 40 o 55 o 65 o 85 o

7
90 o 108 o 54 o 72 o 36 o Rugby Football Cricket Ice Hockey Squash 1 2 Plain Chicken Salt & V Cheese & On Smokey Bacon 115 o 40 o 55 o 65 o 85 o 300 people asked144 packets sold Worksheet 1

8
Musical Instruments Total90 Drawing Pie Charts In a survey, people were asked to indicate which one of five musical instruments they played. The information is given in the table. Display the information in a pie chart. Guitar Violin Recorder Drum 35 10 15 5 Musical Instrument Keyboard25

9
Total90 Guitar Drawing Pie Charts In a survey, people were asked to indicate which one of five musical instruments they played. The information is given in the table. Display the information in a pie chart. Guitar Violin Recorder Drum 35 10 15 5 Musical Instrument Keyboard25

10
Total90 Drawing Pie Charts In a survey, people were asked to indicate which one of five musical instruments they played. The information is given in the table. Display the information in a pie chart. Guitar Violin Recorder Drum 35 10 15 5 Musical Instrument Keyboard25 Guitar

11
Total90 Drawing Pie Charts In a survey, people were asked to indicate which one of five musical instruments they played. The information is given in the table. Display the information in a pie chart. Guitar Violin Recorder Drum 35 10 15 5 Musical Instrument Keyboard25 Guitar Violin

12
Total90 Drawing Pie Charts In a survey, people were asked to indicate which one of five musical instruments they played. The information is given in the table. Display the information in a pie chart. Guitar Violin Recorder Drum 35 10 15 5 Musical Instrument Keyboard25 Guitar Violin

13
Total90 Drawing Pie Charts In a survey, people were asked to indicate which one of five musical instruments they played. The information is given in the table. Display the information in a pie chart. Guitar Violin Recorder Drum 35 10 15 5 Musical Instrument Keyboard25 Guitar Violin Recorder

14
Total90 Drawing Pie Charts In a survey, people were asked to indicate which one of five musical instruments they played. The information is given in the table. Display the information in a pie chart. Guitar Violin Recorder Drum 35 10 15 5 Musical Instrument Keyboard25 Guitar Violin Recorder

15
Total90 Drawing Pie Charts In a survey, people were asked to indicate which one of five musical instruments they played. The information is given in the table. Display the information in a pie chart. Guitar Violin Recorder Drum 35 10 15 5 Musical Instrument Keyboard25 Guitar Violin Recorder Drum Keyboard

16
Total90 Drawing Pie Charts In a survey, people were asked to indicate which one of five musical instruments they played. The information is given in the table. Display the information in a pie chart. Guitar Violin Recorder Drum 35 10 15 5 Musical Instrument Keyboard25 Guitar Violin Recorder Drum Keyboard 140 o 100 o 60 o 40 o 20 o

17
Ice Creams Drawing Pie Charts Total120 Vanilla Banana Chocolate Strawberry 13 22 28 57 Ice-cream Sales The information in the table shows sales of ice-cream from an ice-cream van one Saturday afternoon in the summer. Display the information in a pie chart.

18
Drawing Pie Charts Total120 Vanilla Banana Chocolate Strawberry 13 22 28 57 Ice-cream Sales The information in the table shows sales of ice-cream from an ice-cream van one Saturday afternoon in the summer. Display the information in a pie chart. Vanilla

19
Drawing Pie Charts Total120 Vanilla Banana Chocolate Strawberry 13 22 28 57 Ice-cream Sales The information in the table shows sales of ice-cream from an ice-cream van one Saturday afternoon in the summer. Display the information in a pie chart. Vanilla

20
Drawing Pie Charts Total120 Vanilla Banana Chocolate Strawberry 13 22 28 57 Ice-cream Sales The information in the table shows sales of ice-cream from an ice-cream van one Saturday afternoon in the summer. Display the information in a pie chart. Vanilla Banana

21
Drawing Pie Charts Total120 Vanilla Banana Chocolate Strawberry 13 22 28 57 Ice-cream Sales The information in the table shows sales of ice-cream from an ice-cream van one Saturday afternoon in the summer. Display the information in a pie chart. Banana Vanilla

22
Drawing Pie Charts Total120 Vanilla Banana Chocolate Strawberry 13 22 28 57 Ice-cream Sales The information in the table shows sales of ice-cream from an ice-cream van one Saturday afternoon in the summer. Display the information in a pie chart. Banana Vanilla Chocolate Strawberry

23
Drawing Pie Charts Total120 Vanilla Banana Chocolate Strawberry 13 22 28 57 Ice-cream Sales The information in the table shows sales of ice-cream from an ice-cream van one Saturday afternoon in the summer. Display the information in a pie chart. Banana Vanilla Chocolate Strawberry 39 o 66 o 84 o 171 o

24
Drawing pie charts Use the data in the frequency table to complete the pie chart showing the favourite colours of a sample of people. No of people 10 3 14 5 4 Favourite colour Red Yellow Blue Green Purple Total36

25
Drawing pie charts Use the data in the frequency table to complete the pie chart showing the holiday destinations of a sample of people. Holiday destination No of people UK74 Europe53 America32 Asia11 Other10 Total180

26
Worksheets Total Drawing Pie Charts In a survey, people were asked to indicate which one of five musical instruments they played. The information is given in the table. Display the information in a pie chart. Guitar Violin Recorder Drum 35 10 15 5 Musical Instrument Keyboard25 Worksheet 2

27
Drawing Pie Charts Total Vanilla Banana Chocolate Strawberry 13 22 28 57 Ice-cream Sales The information in the table shows sales of ice-cream from an ice-cream van one Saturday afternoon in the summer. Display the information in a pie chart. Worksheet 3

Similar presentations


 can be shown much more clearly using charts and graphs.>")


; it is split into segments to show percentages.>")
