Download presentation
Presentation is loading. Please wait.

1
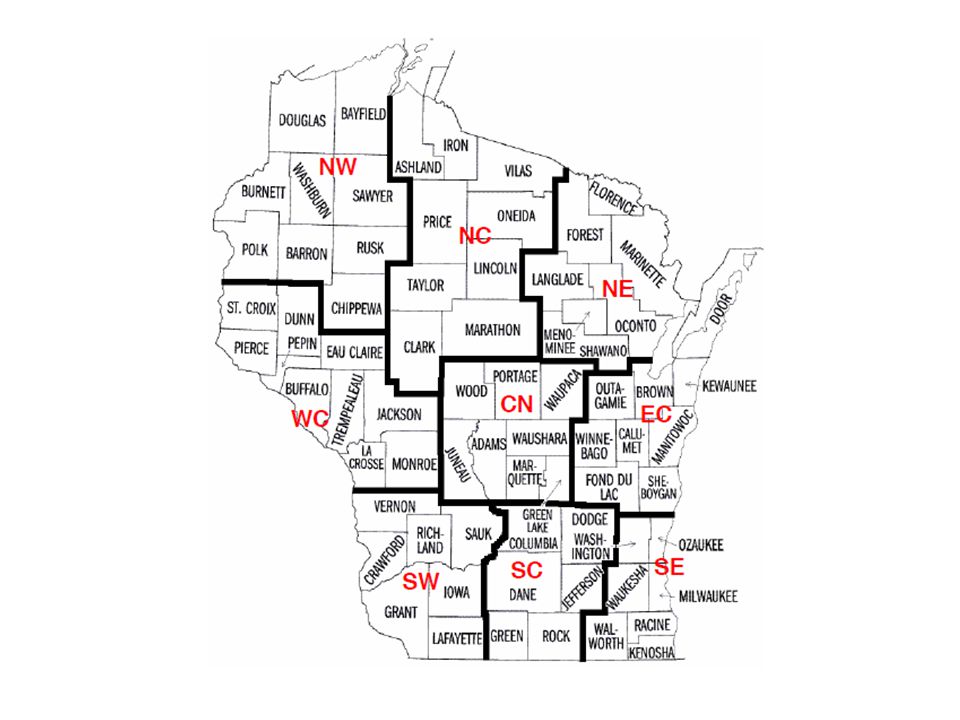
An Overview of Wisconsin and US Agricultural Economy Bruce L. Jones Director, Renk Agribusiness Institute August 2013

2
Outline for Presentation Wisconsin Ag Financial Status Diversification & Dairy Farm Performance Farm Bill Issues Ag Enterprise Performance USDA Long Term Outlook Farmland Values: Wisconsin and Neighboring States

4
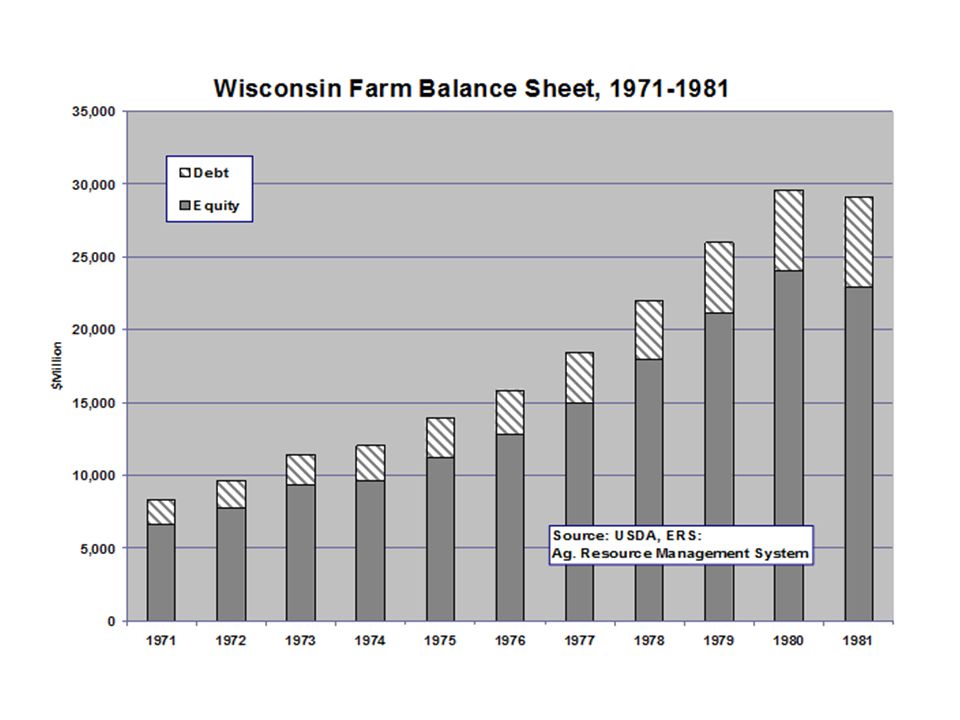
Wisconsin Farm Balance Sheet, December 31, 2007-2011 20072008200920102011 $Million Current Assets5,5586,8186,0386,4636,552 Noncurrent Assets56,68156,85058,46059,10063,359 Total Farm Assets62,23963,66864,49765,56369,911 Current Liabilities1,7121,6241,8361,8151,820 Noncurrent Liabilities5,818.5,2035,839.6,5657,256 Total Farm Liabilities7,5316,8277,6758,3799,076 Farm Equity54,70856,84156,82357,18460,835

9
Dairy

11
U.S. Milk production: 2011 and preliminary 2012 20112012Percent Change United States: Average number of milk cows (1,000) 9,1949,235+0.5% Milk per cow (pounds)21,34621,640+1.4% Total milk production (Billion Lbs.) 196.245199.8+1.9% Wisconsin Average number of milk cows (1,000) 1,2651,270+.4% Milk per cow (pounds)20,64521,383+3.6% Total milk production (Billion Lbs.) 26.127.2+4.1%
 9,1949, % Milk per cow (pounds)21,34621, % Total milk production (Billion Lbs.) % Wisconsin Average number of milk cows (1,000) 1,2651,270+.4% Milk per cow (pounds)20,64521, % Total milk production (Billion Lbs.) %.")
12
2013 Milk Price Forecasts Quarter Jan-MarApr-JunJul-SepOct-Sep Class III$18.40±0.10$18.70±0.10$18.90±0.15$18.20±0.35 Class IV$18.65±0.30$18.50±0.30$18.00±0.15$17.70±0.10 WI All Milk$19.95±0.10$20.25±0.10$20.40±0.10$19.75±0.30

13
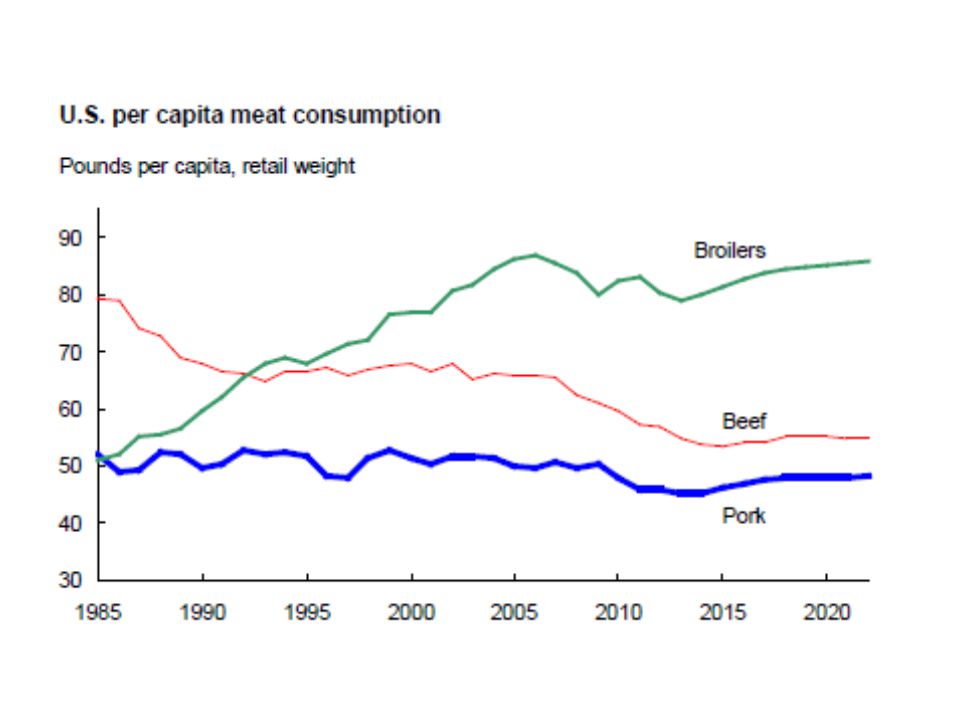
Livestock

14
Changes in Production and Prices for Livestock Products Livestock Species/Product Production in Million PoundsPrice in Cents per Pound 2009 2012 Forecast % Change2009 2012 Forecast % Change Choice Steers 25,963*25,872* -0.4% 83.25122.8548% Lambs 171156 -8.8% 90.10113.5526% Barrows and Gilts 22,993*23,178* 0.8% 41.2461.1048% Broilers 35,51136,939 4.0% 77.6086.812% Turkey 5,6635,981 5.6% 79.50105.733% Eggs** 6,4855,981 3.0% 103.00118.015% *Total production of beef and pork **Volume in million dozen and price in cents/dozen. See source for pricing points. Source: USDA, Livestock, Dairy and Poultry Outlook, December 2011 and December 2012.

16
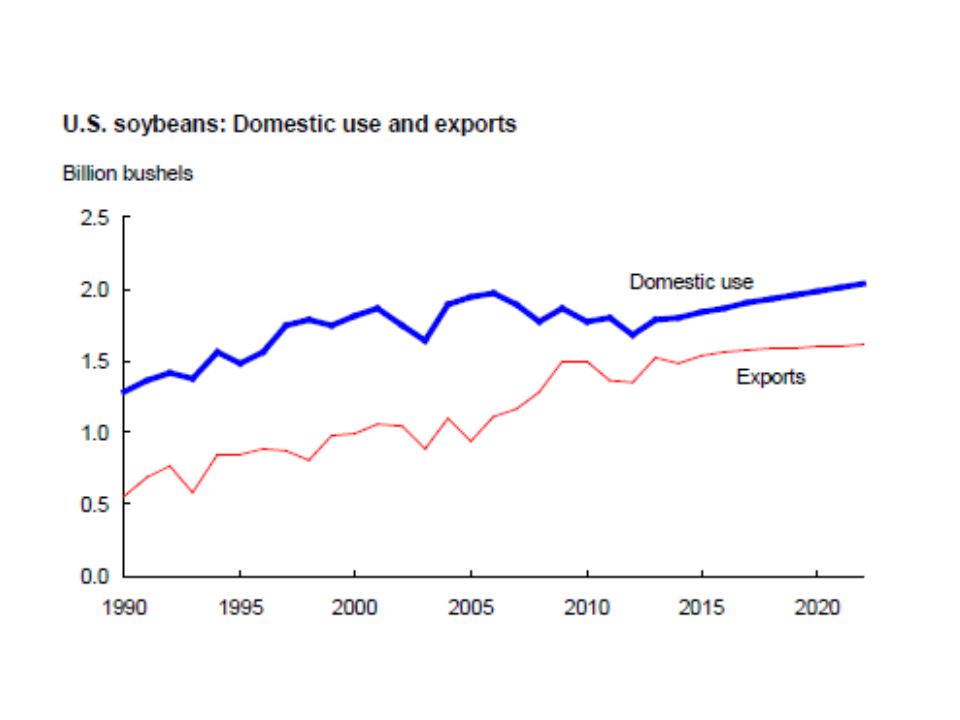
Corn and Soybeans

17
U.S. Corn Balance Sheet (Sep-Aug) Marketing Year05/0606/0707/0808/0909/1010/1111/12*12/13** Million Bushels (Except as Noted) Beg. Stocks2,1141,9671,3041,6241,6741,708 1,128 988 Imports91220141028 29 100 Acres Planted (Mil.)81.578.393.586.086.588.2 91.9 96.9 Acres Harvested (Mil.)75.170.686.578.679.681.4 84.0 87.7 % Harvested92.190.292.591.492.092.2 91.4 90.5 Yield (Bu/A)148149.1150.7153.9164.7152.8 147.2 122.3 Production11,11410,53513,03812,10113,11012,447 12,358 10,728 Total Supply13,23712,51414,36213,73914,79214,26213,515 11,806 Feed and Residual6,1555,5955,9135,2545,1594,792 4,547 4,150 Food/See/Industrial2,9813,4904,3874,9535,9386,428 6,437 5,867 Ethanol1,6032,1193,0493,6774,5685,021 5,011 4,500 Exports2,1342,1252,4371,8581,9871,835 1,543 1,150 Total Demand11,27011,21012,73712,06513,08413,054 12,527 11,167 Ending Stocks1,9671,3041,6241,6741,7081,128 988 647 Stocks to Use (%)17.4511.6312.7513.8712.958.64 7.9 5.8 Average Farm Price ($/Bu.) $2.00$3.04$4.20$4.06$3.55$5.186.22 $6.80 – $8.00 * December Estimate ** December Forecast. Source: USDA, World Agricultural Supply and Demand Estimates.
 Marketing Year05/0606/0707/0808/0909/1010/1111/12*12/13** Million Bushels (Except as Noted) Beg. Stocks2,1141,9671,3041,6241,6741,708 1, Imports Acres Planted (Mil.) Acres Harvested (Mil.) % Harvested Yield (Bu/A) Production11,11410,53513,03812,10113,11012,447 12,358 10,728 Total Supply13,23712,51414,36213,73914,79214,26213,515 11,806 Feed and Residual6,1555,5955,9135,2545,1594,792 4,547 4,150 Food/See/Industrial2,9813,4904,3874,9535,9386,428 6,437 5,867 Ethanol1,6032,1193,0493,6774,5685,021 5,011 4,500 Exports2,1342,1252,4371,8581,9871,835 1,543 1,150 Total Demand11,27011,21012,73712,06513,08413,054 12,527 11,167 Ending Stocks1,9671,3041,6241,6741,7081, Stocks to Use (%) Average Farm Price ($/Bu.) $2.00$3.04$4.20$4.06$3.55$ $6.80 – $8.00 * December Estimate ** December Forecast. Source: USDA, World Agricultural Supply and Demand Estimates..")
19
U.S. Soybean Balance Sheet (Sep-Aug) Marketing Year05/0606/0707/0808/0909/1010/1111/12*12/13** Million Bushels (Except as Noted) Beg. Stocks256449574205138151 215169 Imports3910131514 1620 Acres Planted (Mil.)72.075.564.775.777.577.4 75.077.2 Acres Harvested (Mil.)71.374.664.174.776.476.6 73.875.7 % Harvested99.098.599.098.798.599.0 98.498.1 Yield (Bu/A)4342.741.739.74443.5 41.939.3 Production3,0633,1882,6772,9673,3593,329 3,0942,975 Total Supply3,3223,6473,2613,1853,5123,495 3,3253,160 Crush Sep/Aug1,7391,8081,8031,6621,7521,648 1,7031570 Exports9401,1161,1591,2831,501 1,3621345 F/S/R19414993101108130 91115 Total Demand2,8733,0733,0563,0473,3613,280 3,1563031 Ending Stocks449574205138151215 145115 Stocks to Use (%)15.6218.286.714.537.016.55 5.44.3 Average Farm Price ($/Bu.) $5.66$6.43$10.10$9.97$9.59$11.30$12.50 $13.55- 15.55 * December Estimate ** December Forecast. Source: USDA, World Agricultural Supply and Demand Estimates.
 Marketing Year05/0606/0707/0808/0909/1010/1111/12*12/13** Million Bushels (Except as Noted) Beg. Stocks Imports Acres Planted (Mil.) Acres Harvested (Mil.) % Harvested Yield (Bu/A) Production3,0633,1882,6772,9673,3593,329 3,0942,975 Total Supply3,3223,6473,2613,1853,5123,495 3,3253,160 Crush Sep/Aug1,7391,8081,8031,6621,7521,648 1, Exports9401,1161,1591,2831,501 1, F/S/R Total Demand2,8733,0733,0563,0473,3613,280 3, Ending Stocks Stocks to Use (%) Average Farm Price ($/Bu.) $5.66$6.43$10.10$9.97$9.59$11.30$12.50 $ * December Estimate ** December Forecast. Source: USDA, World Agricultural Supply and Demand Estimates..")
21
Diversification and Dairy Farm Performance

22
Sample Dairy Operations

23
Hay price (P H ) as a function of corn price (P C ) P H = 70.39 + 15.73 P C (6.65) R 2 =.9046
 as a function of corn price (P C ) P H = P C (6.65) R 2 =.9046")
24
Soybean price (P S ) as a function of corn price (P C ) P S = 1.6299 + 1.9126 P C (14.18) R 2 =.9306
 as a function of corn price (P C ) P S = P C (14.18) R 2 =.9306")
25
Soybean Meal price (P SBM ) as a function of soybean price (P S ) P SBM = 36.7135 + 27.917 P S (16.017) R 2 =.9379
 as a function of soybean price (P S ) P SBM = P S (16.017) R 2 =.9379")
26
Cropping Assumptions

27
Dairy Assumptions

28
Assumed Market Conditions Milk ($/CWT) Corn ($/Bu) 3.005.007.00 160.1 0.3 190.10.20.10.4 220.1 0.3 0.40.3
 Corn ($/Bu)")
29
Results DairyCrop/Dairy Average810,5531,280,745 Min-397,478454,374 Max2,018,5852,107,115 Std Dev667,881542,988 C.V0.820.42

30
Farm Bill Issues

37
Likely 2013 Farm Bill Subsidized crop insurance – Voluntary Reduced protections for dairy Dairy Security Act -- Senate Dairy Freedom Act -- House

38
Dairy Security Act Dairy Producer Margin Protection Plan –Voluntary –“Guarantees” producers $4/CWT Income over Feed Costs (IOFC) on 80% historic production –Producers can purchase higher IOFC protection –Administrative fee of up to $2500 –Requires participation in Dairy Market Stabilization Program – Supply Control
 on 80% historic production –Producers can purchase higher IOFC protection –Administrative fee of up to $2500 –Requires participation in Dairy Market Stabilization Program – Supply Control")
39
Dairy Freedom Act Voluntary Margin insurance program where payments of higher premiums can increase IOFC per CWT guarantee from $4 to as much as $8

40
Enterprise Performance USDA-ERS ARMS

53
USDA-ERS Long Run Outlook

65
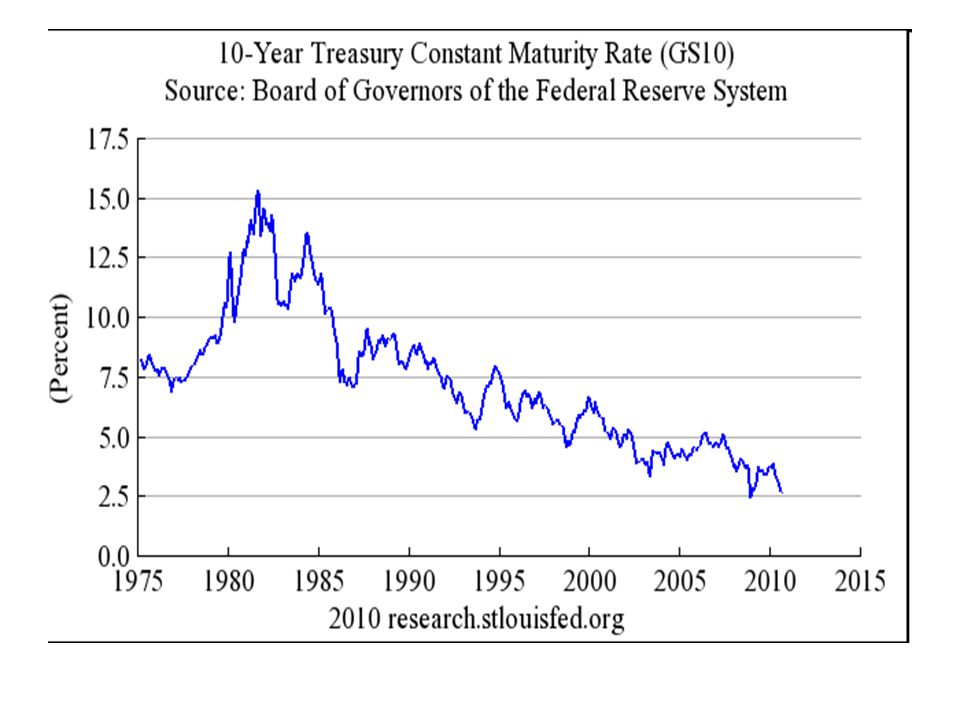
Farmland Values

68
Land Valuation Model V = Value of Land R = Return From Land g = Annual Growth in Return (R) r = Opportunity Cost of Capital
 r = Opportunity Cost of Capital")
69
Trend – Growth of 6.74 % per year

70
Trend – Growth of 5.14 % per year

71
Trend – Growth of 5.26 % per year

74
Trend – Growth of 2.83 % per year

75
Trend – Growth of 3.15 % per year

76
Trend – Growth of 3.87 % per year

77
Correlation: 0.43

78
Correlation: 0.72

79
Correlation: -0.21

80
Correlation: 0.77

81
Correlation: -0.33

82
Correlation: 0.84

83
Correlation: -0.9024

84
Correlation: -0.8616

85
Correlation: -0.8505

94
Grain Markets and Ethanol Production

95
US Gasoline Consumption 367 Million Gallons / Day --- 134 Billion Gallons / Year Energy Information Administration

96
What’s in a bushel of corn? Corn Dry Milling Process Overview 1 Bushel of2.85 Gallons of18 Pounds of18 Pounds of Corn Ethanol DDGS CO 2

97
Corn Demands To Meet Ethanol Blending Needs Associated With 134 Billion Gallons Of Annual Gasoline Consumption Blend rate (%)Corn needs (Billions of Bu.) 104.7 12.55.9 157.1
Corn needs (Billions of Bu.)")
98
CORN 2010/112011/12 Est.2012/13 Proj. JanFeb Million Acres Area Planted 88.291.997.2 Area Harvested 81.48487.4 Bushels Yield per Harvested Acre 152.8147.2123.4 Million Bushels Beginning Stocks 17081128989 Production 124471236010780 Imports 2829100 Supply, Total 141821351611869 Feed and Residual 479545484450 Food, Seed & Industrial 2/ 6426643758675887 Ethanol & by-products 3/ 501950114500 Domestic, Total 11221109851031710337 Exports 18341543950900 Use, Total 13055125271126711237 Ending Stocks 1128989602632 CCC Inventory 0000 Free Stocks 1128989602632 Outstanding Loans 484150 Avg. Farm Price ($/bu) 4/ 5.186.226.80 - 8.006.75 - 7.65 US Balance Sheet For Corn
 4/ US Balance Sheet For Corn.")
Similar presentations


265-8508.>")


