Download presentation
Presentation is loading. Please wait.

2
Lifetime Risk of Coronary Heart Disease in the Framingham Study
____________________________________________________________ Lifetime Risk of Coronary Heart Disease in the Framingham Study ______________________________________________________________ Men Women At age 40 years: 48.6% 31.7% At age 70 years: 34.9% 24.2% Lloyd-Jones et al. Lancet 1999; 353:89-92 _________________________________________________________________

3
First Coronary Events: Framingham Study
____________________________________________________________ First Coronary Events: Framingham Study ________________________________________________________ Percent as Specified Event Myocardial Angina Sudden Infarction Pectoris Death Age Men Women Men Women Men Women % 28% % % % 4% % 44% % % % 7.4% Framingham Study 44 year follow-up. ____________________________________________________________

4
Estimated 10-Year CHD Risk in
55-Year-Old Adults According to Levels of Various Risk Factors Framingham Heart Study A B C D Blood Pressure (mm Hg) 120/80 140/90 140/90 140/90 Total Cholesterol (mg/dL) HDL Cholesterol (mg/dL) Diabetes No No Yes Yes Cigarettes No No No Yes mm Hg = millimeters of mercury mg/dL = milligrams per deciliter of blood Source: Circulation 1998;97:
 120/80 140/90 140/90 140/90. Total Cholesterol (mg/dL) HDL Cholesterol (mg/dL) Diabetes No No Yes Yes. Cigarettes No No No Yes. mm Hg = millimeters of mercury. mg/dL = milligrams per deciliter of blood. Source: Circulation 1998;97:")
5
Estimated 10-Year Stroke Risk in 55-Year-Old Adults According to Levels of Various Risk Factors Framingham Heart Study A B C D E F Systolic BP* Diabetes No No Yes Yes Yes Yes Cigarettes No No No Yes Yes Yes Prior Atrial Fib. No No No No Yes Yes Prior CVD No No No No No Yes *BP in millimeters of mercury (mmHg) Source: Stroke 1991;22:
 Source: Stroke 1991;22:")
6
A B C D E F Systolic BP* Diabetes No No Yes Yes Yes Yes Cigarettes No No No Yes Yes Yes Prior Atrial Fib. No No No No Yes Yes Prior CVD No No No No No Yes *BP in millimeters of mercury (mmHg) Estimated 10-year stroke risk in 55-year-old adults according to levels of various risk factors (FHS). Source: Wolf et al., Stroke.1991;22:
 Estimated 10-year stroke risk in 55-year-old adults according to levels of various risk factors (FHS). Source: Wolf et al., Stroke.1991;22:")
7
Offspring CVD Risk by Parental CVD Status: Framingham Study
Parental CVD <55 men, <65 Women Risk Ratio 2.5 2 2.2 1.5 1.7 1.7 1.7 1 1.0 1.0 0.5 Men Women Adjusted for: age, total/HDL Chol. ratio, SBP, smoking, diabetes, BMI

8
Risk imposed by a strong family history of heart attacks varies widely depending on the burden of modifiable risk factors Multivariable Risk

9
Doubts about cholesterol as late as 1989

10
Risk of Coronary Heart Disease by Serum Cholesterol
30-Year Follow-up, The Framingham Study Age-Adjusted Annual Rate per 1000 Serum Cholesterol Age: 35-64* Age: 65-94 Men Women Men+ Women* 84-204 8 4 22 11 13 5 24 15 14 26 17 7 23 10 38 32 *Trends Significant at P P.07.

11
Correlation Between Serum Cholesterol and CVD Mortality
Multiple Risk Factor Intervention Trial (MRFIT) N=325,346 30 Untreated Patients 25 55-57 years 20 50-54 years 6-Year CVD Death Rate Per 1000 15 45-49 years 10 40-44 years 35-39 years 5 Q1 (<182) Q2 ( ) Q3 ( ) Q4 ( ) Q5 (>244) Serum Cholesterol Quintile (mg/dL) Q = serum cholesterol quintile. Kannel WB et al. Am Heart J. 1986;112:
 N=325, Untreated Patients years years. 6-Year CVD Death Rate Per years years years. 5. Q1. (<182) Q2. ( ) Q3. ( ) Q4. ( ) Q5. (>244) Serum Cholesterol Quintile (mg/dL) Q = serum cholesterol quintile. Kannel WB et al. Am Heart J. 1986;112:")
12
Lifetime Risk of CHD Increases with Serum Cholesterol
_______________________________________________________________________________ Lifetime Risk of CHD Increases with Serum Cholesterol ___________________________________________________________________________ Cholesterol 57 44 34 33 29 19 Framingham Study: Subjects age 40 years DM Lloyd-Jones et al Arch Intern Med 2003;

13
Age-adjusted prevalence of Adults age 20 and older with LDL cholesterol of 130 mg/dL or higher, by race/ethnicity and sex (NHANES: ). Source: NCHS and NHLBI. NH – non-Hispanic.

14
Age-adjusted prevalence of Adults age 20 and older with HDL cholesterol <40 mg/dL, by race/ethnicity and sex (NHANES: ) Source: NCHS and NHLBI. NH – non-Hispanic.

15
Trends in mean total serum cholesterol among adults age 20 and older, by race/ethnicity, sex and survey (NHANES : , and ). Source: NCHS and NHLBI. NH – non-Hispanic.

16
Trends in mean total blood cholesterol among adolescents ages by race, sex, and survey (NHES: ; NHANES: and ). Source: NCHS and NHLBI.

17
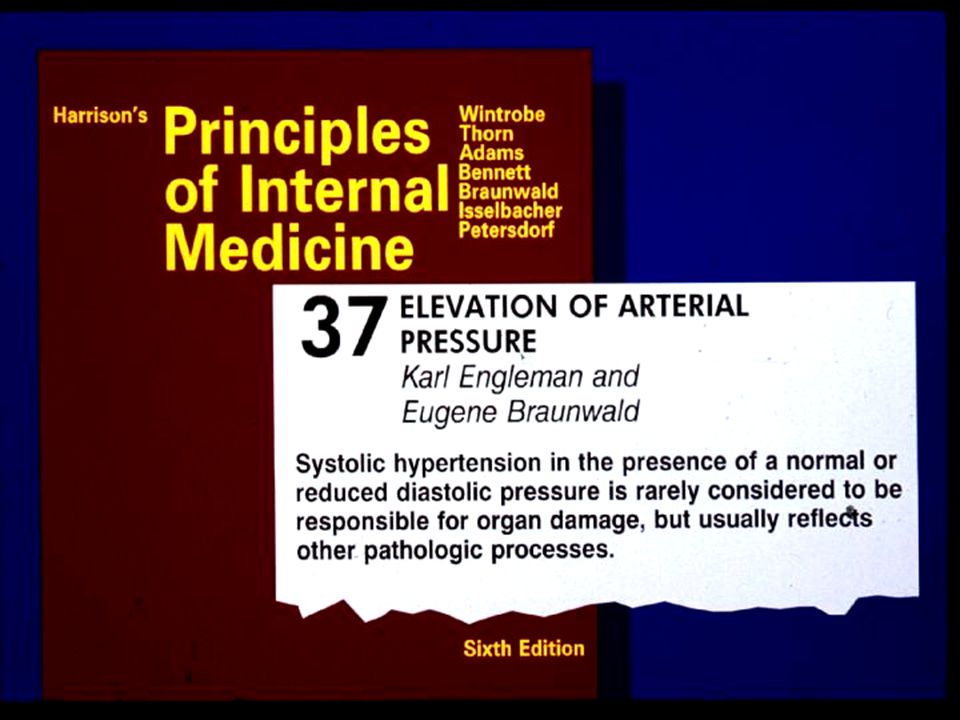
CK Friedberg on Hypertension: Diseases of the Heart 1996
________________________________________________________ CK Friedberg on Hypertension: Diseases of the Heart 1996 “There is a lack of correlation in most cases between the severity and duration of hypertension and development of cardiac complications.” _______________________________________________________________

20
Relation of Non-Hypertensive Blood Pressure to Cardiovascular Disease Vasan R, et al. N Engl J Med 2001; 345: 10-year Age- Adjusted Cumulative Incidence Hazard Ratio* SBP Women Men <120/ H.R. adjusted for age, BMI, Cholesterol, Diabetes and smoking *P<.001 10.1 7.6 5.8 4.4 2.8 1.9 Framingham Study: Subjects Ages yrs.

21
Prevalence of high blood pressure in Adults by age and sex (NHANES: ). Source: NCHS and NHLBI.

22
Extent of awareness, treatment and control of high blood pressure by age (NHANES : ) Source: NCHS and NHLBI.
 Source: NCHS and NHLBI.")
23
Age-adjusted prevalence trends for high blood pressure in Adults age 20 and older by race/ethnicity, sex and survey (NHANES: and ). Source: NCHS and NHLBI.

24
Extent of Awareness, Treatment and Control of High Blood Pressure by Race/Ethnicity (NHANES: ). Source: NCHS and NHLBI.

25
CK Friedberg on Hypertension Diseases of the Heart 1966
_______________________________________________________________ CK Friedberg on Hypertension Diseases of the Heart 1966 “Hypertension imposes a load on the heart which for many years may be compensated by left ventricular hypertrophy”

26
CVD Risk Imposed by ECG-LVH Framingham Study 36-yr. Follow-up
_______________________________________________________________ CVD Risk Imposed by ECG-LVH Framingham Study 36-yr. Follow-up _______________________________________________________________ Age-adjusted Risk Excess Risk Rate per Ratio per 1000 Age Men Women Men Women Men Women *** 7.4*** *** 4.1*** Biennial Rate per CVD=CHD, stroke, peripheral vascular disease, heart failure ***P<0.001 _____________________________________________________________

27
Smoking Statement Issued in 1956 by American Heart Association
____________________________________________________________ Smoking Statement Issued in 1956 by American Heart Association ___________________________________________________________ “It is the belief of the committee that much greater knowledge is needed before any conclusions can be drawn concerning relationships between smoking and death rates from coronary heart disease. The acquisition of such knowledge may well require the use of techniques and research methods that have not hitherto been applied to this problem.” Circulation 1960; vol. 23 ___________________________________________________________

28
CHD Risk by Cigarette Smoking. Filter Vs. Non-filter. Framingham Study
CHD Risk by Cigarette Smoking. Filter Vs. Non-filter. Framingham Study. Men <55 Yrs. 14-yr. Rate/1000 210 206 210 119 112 59

29
Prevalence of current smoking for Adults age 18 and older by race/ethnicity and sex (NHIS:2004).
Source: MMWR. 2004;54: NH – non-Hispanic.

30
Prevalence of high school students in grades 9-12 reporting current cigarette smoking by race/ethnicity and sex. (YRBS:2005) Source: MMWR. 2006;55:SS-5. June 9, NH – non-Hispanic.
. Source: MMWR. 2006;55:SS-5. June 9, NH – non-Hispanic..")
31
Diseases of The Heart Charles K Friedberg MD, WB Saunders Co
Diseases of The Heart Charles K Friedberg MD, WB Saunders Co. Philadelphia, 1949 ________________________________________________________________ “The proper control of diabetes is obviously desirable even though there is uncertainty as to whether coronary atherosclerosis is more frequent or severe in the uncontrolled diabetic” ______________________________________________________________

32
Risk of Cardiovascular Events in Diabetics Framingham Study
_________________________________________________________________ Age-adjusted Biennial Rate Age-adjusted Per Risk Ratio Cardiovascular Event Men Women Men Women Coronary Disease ** *** Stroke *** 2.6*** Peripheral Artery Dis *** 6.4*** Cardiac Failure *** 7.8*** All CVD Events *** 3.7*** Subjects year Follow-up **P<.001,***P<.0001 _________________________________________________________________

33
Age-adjusted prevalence of physician-diagnosed diabetes in Adults age 18 and older by race/ethnicity and sex (NHANES: ) Source: NCHS and NHLBI. NH – non-Hispanic.

34
Mortality rates in U.S. adults, age 30-75, with metabolic syndrome (MetS), with and without diabetes mellitus (DM) and pre-existing CVD (NHANES II: Follow-up Study). ** Source: Malik et al., Circulation. 2004;110: ** Average of 13 years of follow-up Note: Age and gender adjusted.

36
Skepticism About Importance of Obesity
Keys A, Aravanis C, Blackburn H, et al. Ann Intern Med 1972; 77:15-27. Concluded that all the excess risk of coronary heart disease in the obese derives from its atherogenic accompaniments, illogically leaving the impression that obesity is therefore unimportant. Mann GV. N Engl J Med 1974; 291: “The contribution of obesity to CHD is either small or non-existent. It cannot be expected that treating obesity is either logical or a promising approach to the management of CHD”. Barrett-Connor EL. Ann Intern Med 1985; 103: NIH consensus panel is equivocal about the role of obesity as a cause of CHD.

37
Relation of Weight Change to Changes in
Atherogenic Traits: The Framingham Study Frantz Ashley, Jr. and William B Kannel J Chronic Dis 1974 “Weight gain is accompanied by atherogenic alterations in blood lipids, blood pressure, uric acid and carbohydrate tolerance.” “It seems reasonable to expect that correction of overweight will improve the coronary risk problem.” “Avoidance of overweight would seem a desirable goal in the general population if the appalling annual toll from disease is to be substantially reduced.”

38
Risk Factor Sum and Obesity
Framingham Study ( ) and ( ) 3 2.4 (1971) (1989) Risk factors accumulate with weight gain 1.8 Risk Factor Sum 1.2 Wilson PWF, & Kannel WB Nutr Clin Care 1999; 1:44-50 0.6 Q1 Q2 Q3 Q4 Q5 Overall Thin Obese Risk variables include bottom quintile for HDL-C and top quintiles for cholesterol, SBP, triglycerides and glucose
 and ( ) (1971) (1989) Risk factors accumulate with weight gain Risk Factor Sum Wilson PWF, & Kannel WB Nutr Clin Care 1999; 1: Q1 Q2 Q3 Q4 Q5 Overall. Thin. Obese. Risk variables include bottom quintile for HDL-C and top quintiles for cholesterol, SBP, triglycerides and glucose.")
39
Age-adjusted prevalence of obesity in Adults ages by sex and survey (NHES, ; NHANES, , , and ). Source: Health, United States, 2006, unpublished data. NCHS. Note: Obesity is defined as a BMI of 30.0 or higher.

40
Trends in prevalence of overweight among U. S
Trends in prevalence of overweight among U.S. children and adolescents by age and survey (NHANES, , , and ). Source: Health, United States, 2006, unpublished data. NCHS.
. Source: Health, United States, 2006, unpublished data. NCHS.")
41
Prevalence of overweight among students in grades 9-12 by race/ethnicity and sex (YRBS: 2005). Source: BMI 95th percentile or higher. MMWR : No. SS-5. NH – non-Hispanic.

42
Prevalence of leisure-time physical inactivity among adults age 18 and older by race/ethnicity, and sex. (BRFSS: 1994 and 2004). Source: MMWR, 2005;54:No NH – non-Hispanic.
. Source: MMWR, 2005;54:No. 39. NH – non-Hispanic..")
43
Note: “Currently recommended levels” is defined as activity that increased their heart rate and made them breathe hard some of the time for a total of at least 60 minutes/day on 5 or more of the 7 days preceding the survey. Prevalence of students in grades 9-12 who met currently recommended levels of physical activity during the past 7 days by race/ethnicity and sex (YRBS: 2005). Source: MMWR. 2006;55:No. SS-5. NH – non-Hispanic.
. Source: MMWR. 2006;55:No. SS-5. NH – non-Hispanic.")
Similar presentations


 describes relative weight for height: weight (kg)/height (m 2 ) Overweight = 25–29.9 BMI Obesity = >30 BMI.>")


 The LIPID Study Group N Engl J Med 1998;339:1349-57.>")


![LIFESTYLE MODIFICATIONS FOR PREVENTING HEART DISEASE [e.g. HEART ATTACKS] [ primary prevention of coronary artery disease ] DR S. SAHAI MD [Med.], DM [Card]](/19/5810187/big_thumb.jpg "LIFESTYLE MODIFICATIONS FOR PREVENTING HEART DISEASE [e.g. HEART ATTACKS] [ primary prevention of coronary artery disease ] DR S. SAHAI MD [Med.], DM [Card]>")