Download presentation
Presentation is loading. Please wait.

1
Does the U.S. Feed the World?
Economic Research Service U.S. Department of Agriculture

4
World Cereal Production (2004)

6
Animal Feed: 40% of Global Grain Production (70% of U. S
Animal Feed: 40% of Global Grain Production (70% of U.S. Grain Produciton) Animal Feed Demand
 Animal Feed Demand.")
7
World Meat Production (2004)

8
Most Meat is Produced in Developing Countries
MEAT PRODUCTION Source: FAO (2005) MILK PRODUCTION Source: FAO (2005)
 MILK PRODUCTION. Source: FAO (2005)")
9
Livestock Revolution

10
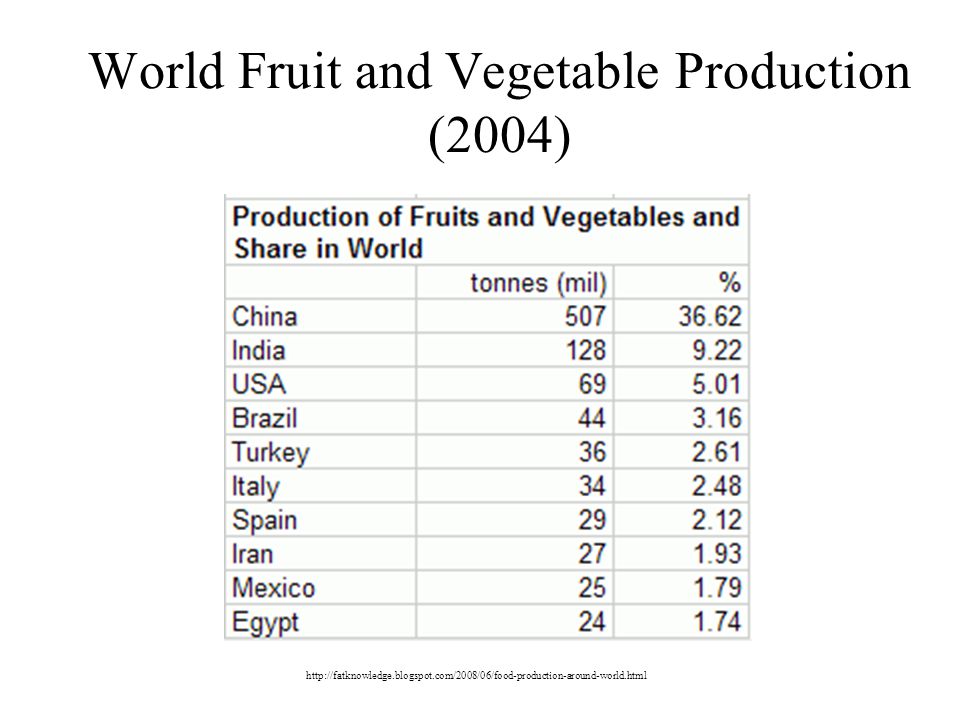
World Fruit and Vegetable Production (2004)
11
U.S. ag exports exceed imports

12
U.S. food imports 2003 (Total: $45.7 Billion)
Horticultural products $23.2 Billion Animals, animal products $8.6 Billion Coffee, cocoa, rubber $5.3 Billion Grains and feeds $3.9 Billion Sugar, tobacco $2.8 Billion Oilseeds, oilseed products $2.0 Billion

13
Who does the U.S. Import food from?
Value of U.S. agricultural imports, ranked by country Fiscal year Growth Country 2000 2001 2002 2003 (billion U.S.$) Percent European Union 8.3 8.1 8.7 10.3 5.7% Canada 8.5 9.5 10.2 4.7% Mexico 5.0 5.3 6.0 Australia 1.5 1.8 1.9 2.0 6.8% Brazil 1.2 1.0 1.1 4.1% New Zealand 1.3 3.9% Chile 5.4% China, mainland 0.8 9.9% Indonesia 0.9 3.7% Colombia -3.0% World 38.9 39.0 41.0 45.7 1.5% Source: Economic Research Service, USDA and the Census Bureau, U.S. Department of Commerce.
 Percent. European Union % Canada % Mexico Australia % Brazil % New Zealand % Chile. 5.4% China, mainland % Indonesia % Colombia. -3.0% World % Source: Economic Research Service, USDA and the Census Bureau, U.S. Department of Commerce.")
14
U.S. Food Exports 2003 (Total: $56.2 Billion)
Grain, grain products $14.8 Billion Animals, animal products $11.9 Billion Oilseeds, oilseed products 10.2 Billion Fruits, nuts, juice, wine $6.3 Billion Sugar, tropical products $4.3 Billion Cotton, tobacco $3.9 Billion Vegetable Products $1.3 Billion

15
Who does the U.S. Export food to?
Value of U.S. agricultural exports, ranked by country Fiscal year Growth Country 2000 2001 2002 2003 (billion U.S.$) Percent Canada 7.5 8.0 8.6 9.1 5.0% Japan 9.3 8.9 8.3 8.8 -1.3% Mexico 6.3 7.3 7.1 7.6 4.8% European Union 6.5 -0.6% China, mainland 1.5 1.9 1.8 3.5 24.2% South Korea 2.5 2.7 2.8 2.2% Taiwan 2.0 -0.7% Hong Kong 1.2 1.3 1.1 -4.0% Indonesia 0.7 0.9 0.8 8.0% Turkey 0.6 5.8% World 50.7 52.7 53.3 56.2 2.6% Source: Economic Research Service, USDA and Census Bureau, U.S. Department of Commerce. Imports
 Percent. Canada % Japan % Mexico % European Union % China, mainland % South Korea % Taiwan % Hong Kong % Indonesia % Turkey % World % Source: Economic Research Service, USDA and Census Bureau, U.S. Department of Commerce. Imports.")
16
U.S. Produces 44% of World’s Corn

17
Global Maize Production

18
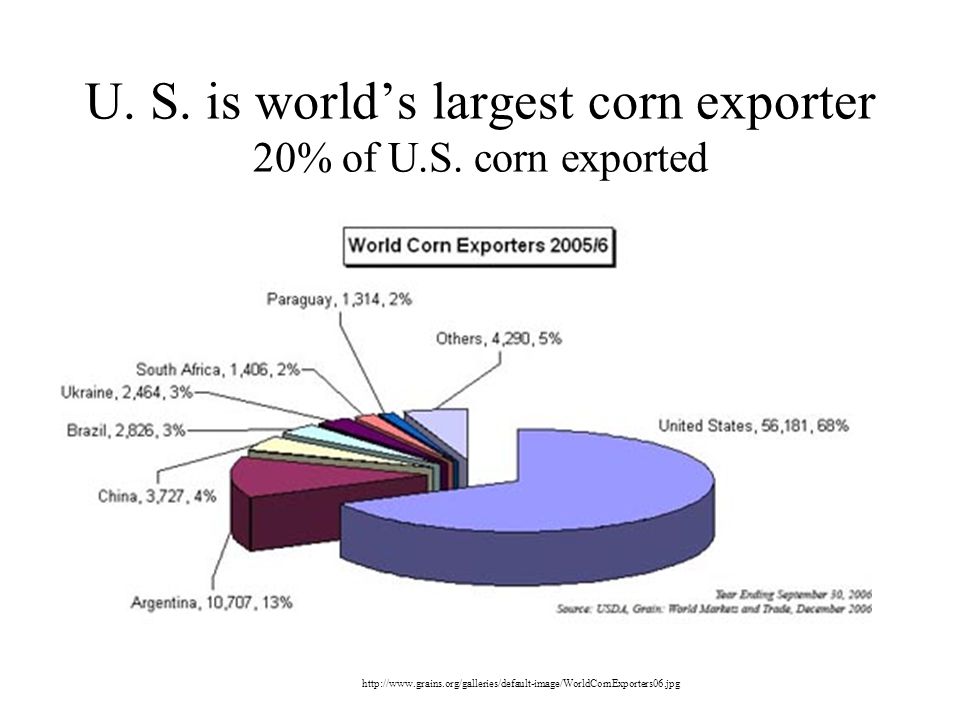
U. S. is world’s largest corn exporter 20% of U.S. corn exported
19
Japan is the largest importer of U.S. Corn

20
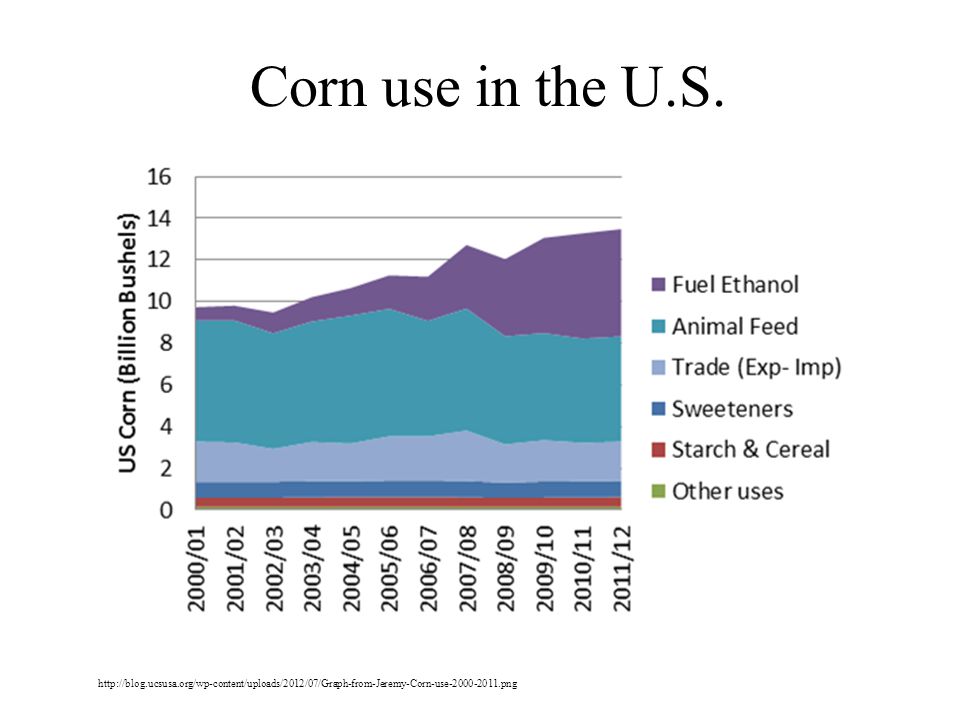
Corn use in the U.S.
21
World Wheat Production
Total U.S. Production: 57,000,000 MT (2006) Total World Production: 593,000,000 MT (2006)
 Total World Production: 593,000,000 MT (2006)")
22
U.S. Wheat Exports (2006: 48% of U.S. wheat exported)
U.S. is world’s largest wheat exporter: 24% of market

23
Rice Total World Rice Production: Total U.S. Rice Production:
588,563,933 MT Total U.S. Rice Production: 9,033,610 MT

24
Global Rice Production

25
U.S. grows 39% of world’s soybeans

26
Soy Exports (2003: $6.5 Billion Dollars)
Top Ten U.S. Export Customers $ Million Soy Exports (2003: $6.5 Billion Dollars) Soybean Exports China $2,889 European Union-15 $1,114 Mexico $981 Japan $957 Taiwan $419 Indonesia $324 Korea $282 Thailand $181 Canada $158 Turkey $91 All Others $583 Total $7,980 Soybean Meal Exports Canada $242 Mexico $150 Indonesia $96 Australia $83 Dominican Republic $73 Japan $61 Philippines $57 Turkey $44 Venezuela $40 Algeria $39 All Others $304 Total $1,189 Soybean Oil Exports Mexico $82 Canada $72 Cuba $50 China $48 Egypt $27 Korea $21 India Peru $19 Iraq 14 Turkey 13 All Others $188 Total $556 50% of U.S. soy is exported
 Soybean Exports. China. $2,889. European Union-15. $1,114. Mexico. $981. Japan. $957. Taiwan. $419. Indonesia. $324. Korea. $282. Thailand. $181. Canada. $158. Turkey. $91. All Others. $583. Total. $7,980. Soybean Meal Exports. Canada. $242. Mexico. $150. Indonesia. $96. Australia. $83. Dominican Republic. $73. Japan. $61. Philippines. $57. Turkey. $44. Venezuela. $40. Algeria. $39. All Others. $304. Total. $1,189. Soybean Oil Exports. Mexico. $82. Canada. $72. Cuba. $50. China. $48. Egypt. $27. Korea. $21. India. Peru. $19. Iraq. 14. Turkey. 13. All Others. $188. Total. $ % of U.S. soy is exported.")
27
U.S. Meat Exports

28
U.S. Beef Exports

29
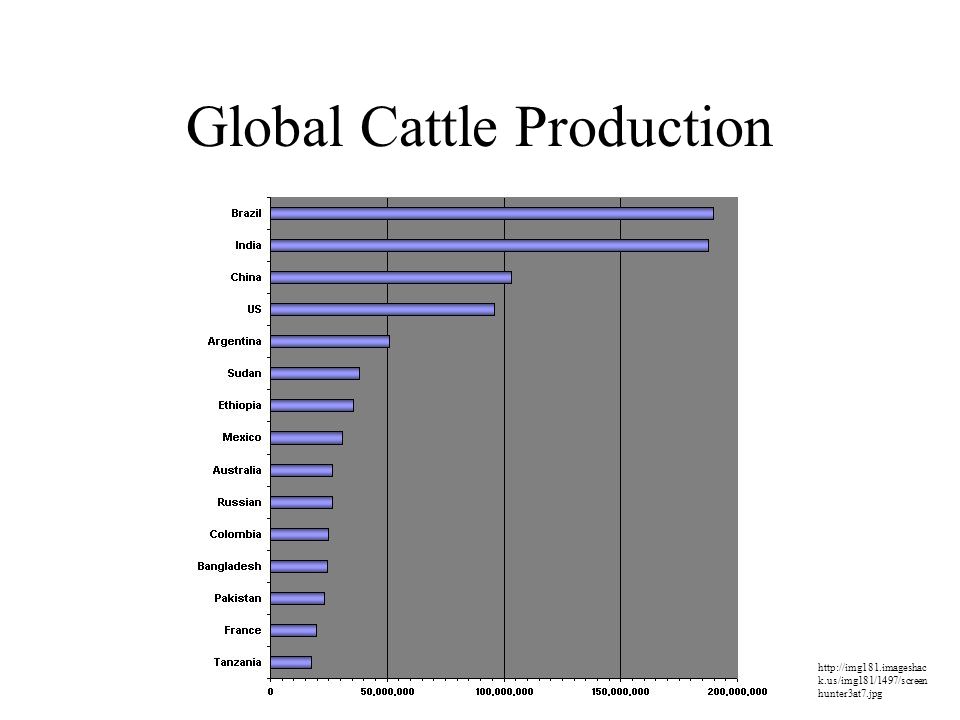
Global Cattle Production
30
World: 1.3 billion cattle: projected to double by 2050

31
India World’s top producer of milk and dairy products
Poultry meat production has tripled Last decade Many moved away from strict vegetarian diet Fast foods

32
Poultry Production in India
TRENDS IN POULTRY MEAT PRODUCTION IN INDIA Source: FAO (2005)
")
33
Global Chicken Production

34
U.S. Broiler Meat Export

35
U.S. Pork Exports

36
China China Pork Market
China: leads world in meat production and consumption #1 in pork, mutton, eggs, aquaculture #2 in poultry, #3 Beef Must import feed to support pig, poultry industry Still a net exporter of feed Last decade Production up 2x per capita consumption up 3x Pork: 66% of meat consumed China Pork Market

37
Global Hog Production

Similar presentations


 Malaysia.>")