Download presentation
Presentation is loading. Please wait.

1
Caroline Nowlan, Xiong Liu, Cheng Liu, Gonzalo Gonzalez Abad, Kelly Chance Harvard-Smithsonian Center for Astrophysics, Cambridge, MA James Leitch, Joshua Cole, Tom Delker, Bill Good, Frank Murcray, Lyle Ruppert, Dan Soo Ball Aerospace, Boulder, CO Chris Loughner, Melanie Follette-Cook, Scott Janz, Matt Kowalewski, Ken Pickering NASA GSFC, Greenbelt, MD

2
New test-bed instrument for the geostationary TEMPO (scheduled for launch 2018-2019) and GEO-CAPE (Decadal Survey) satellite instruments First flights happened during DISCOVER-AQ on NASA Falcon Texas 2013 (6 flight days) Colorado 2014 (12 flight days)
 and GEO-CAPE (Decadal Survey) satellite instruments First flights happened during DISCOVER-AQ on NASA Falcon Texas 2013 (6 flight days) Colorado 2014 (12 flight days)")
3
Measures with 2 detector arrays UV: 280 – 410 nm (O 3, HCHO, SO 2 ) Visible: 416 – 690 nm (NO 2, O 3, aerosols) 2-D CCD array detector One dimension across flight track and one in wavelength dimension Resolution at surface: ~500x500 m 2 (NO 2, HCHO, O 3 ) ~1x1 km 2 (SO 2 ) We retrieve slant columns using nearby zenith-sky reference spectra, then convert to vertical columns with air mass factor from a radiative transfer code (VLIDORT, Spurr et al., 2006) using CMAQ at 4x4 km 2 resolution
 Visible: 416 – 690 nm (NO 2, O 3, aerosols) 2-D CCD array detector One dimension across flight track and one in wavelength dimension Resolution at surface: ~500x500 m 2 (NO 2, HCHO, O 3 ) ~1x1 km 2 (SO 2 ) We retrieve slant columns using nearby zenith-sky reference spectra, then convert to vertical columns with air mass factor from a radiative transfer code (VLIDORT, Spurr et al., 2006) using CMAQ at 4x4 km 2 resolution")
4
Texas campaign: NO 2 vertical columns available UV radiance calibration needs refinement Colorado campaign: NO 2 and SO 2 slant columns available for 4 of 12 days To come: Ozone profiles, NO 2 vertical columns, HCHO, more flights to process First Houston data should be up on DISCOVER- AQ data archive by the end of May. Contact: cnowlan@cfa.harvard.edu

5
Houston: 09/13, 09/14, 09/18, 09/24 GeoCAPE ocean color flight: 09/17 OMI underflight: 09/16 Transit out (GA power plants): 09/12 Transit back (NC power plants): 09/24 (NO 2 data in red are currently available.)
: 09/12 Transit back (NC power plants): 09/24 (NO 2 data in red are currently available.)")
6
Transit back (power plants, Kansas City, St. Louis): 08/13 Transit out (power plants): 07/25 Denver: 07/29, 07/31, 08/01, 08/02, 08/06, 08/08, 08/10, 08/11 West Colorado power plants: 08/09 Plateville Oil & Gas: 08/03 (NO 2 data in red are currently available.)
: 08/13 Transit out (power plants): 07/25 Denver: 07/29, 07/31, 08/01, 08/02, 08/06, 08/08, 08/10, 08/11 West Colorado power plants: 08/09 Plateville Oil & Gas: 08/03 (NO 2 data in red are currently available.).")
7
Vertical Column 13 Sept 2013 10:00-11:30AM 18 Sept 2013 9:00-11:45AM 24 Sept 2013 10:00-11:45AM 14 Sept 2013 2:00-5:00PM

8
Vertical Column

9
Cloud-free observations Small bias, possible causes to be investigated: Aerosols not currently included in radiative transfer model for air mass factor calculation Effects from zenith sky observations or background offset removal using clean observations over water

10
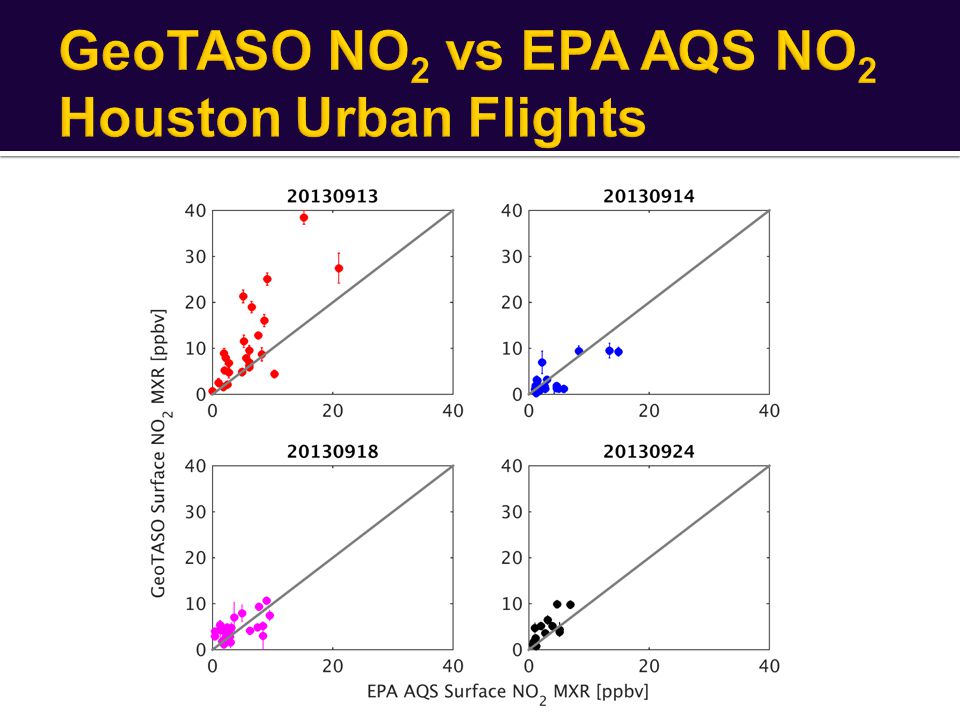
Lamsal et al. (2008) method is often used to infer surface mixing ratio from satellite measurements: Scale satellite vertical column density (VCD) using a model to get surface concentration (S).
 method is often used to infer surface mixing ratio from satellite measurements: Scale satellite vertical column density (VCD) using a model to get surface concentration (S)..")
12
Close flights on 13 September 2013 show very similar NO 2 Both analyzed with GeoTASO algorithm

13
8:00 – 11:30 AM LOCAL TIME 2:00 – 4:00 PM LOCAL TIME Slant Column

14
Photo by J.B. Forbes GeoTASO measured coincident slant columns of NO 2 and SO 2 downwind from Missouri’s largest coal-burning power plant, on transit back to Virginia

15
O 3 profile work in preparation for TEMPO mission Formaldehyde retrieval optimization Aerosol sensitivities in air mass factor Process rest of Colorado data Improvements to UV calibration for Houston campaign Comparisons with GCAS, P-3B and satellites Responsibility for GeoTASO transferring this year from Ball Aerospace to NASA Goddard (Scott Janz)
")
Similar presentations


 University of Maryland AQAST-3 June 13, 2012 Madison, WI The MDE/UMD.>")


 12.04.2007 3 rd GEOS-Chem USERS ` MEETING, Harvard University.>")

 modeled NOx emission inventories.>")
 Kelly Chance & the TEMPO Team April 6, 2013.>")


 ESTO IIP 21 May 2013 Jim Leitch,>")
