Download presentation
Presentation is loading. Please wait.

1
Applications of HGP Genetic testing Forensics Figure 11.3

2
Genetic testing testing for a pathogenic mutation in a certain gene in an individual that indicate a person’s risk of developing or transmitting a disease Used for mutation screening of disease genes e.g. HD, CFTR, DMD Figure 11.3

3
Genetic testing can be done in 3 ways
Directly Gene tracking Population screening Figure 11.3

4
DIRECT GENETIC TESTING
Based on either MUTATION DETECTION: screening for KNOWN polymorphisms in DNA MUTATION SCANNING: screening for UNKNOWN polymorphisms in DNA Figure 11.6

5
SNPs by RFLP-PCR MUTATION DETECTION
Must have sequence on either side of polymorphism Amplify fragment Expose to restriction enzyme Gel electrophoresis e.g., sickle-cell genotyping with a PCR based protocol Figure 11.7 Fig Hartwell

6
SNPs by ASOs MUTATION DETECTION
Figure 11.8 Very short specific probes (<21 bp) which hybridize to one allele or other Such probes are allele-specific oligonucleotides (ASOs) Fig. 11.8
 which hybridize to one allele or other. Such probes are allele-specific oligonucleotides (ASOs) Fig")
7
Variation in length of DNA sequence (repetitive DNA)
MUTATION DETECTION Variation in length of DNA sequence (repetitive DNA) Huntington’s disease -a microsatellite triplet repeat in a coding region Figure 11.8 Figure 18.12: HMG3
 Huntington’s disease -a microsatellite triplet repeat in a coding region. Figure Figure 18.12: HMG3.")
8
SCREENING TARGET LOCI FOR UNKNOWN MUTATIONS
MUTATION SCANNING SCREENING TARGET LOCI FOR UNKNOWN MUTATIONS RISKY SENSITIVE SPECIFIC CFTR mutation frequency F % G551D 2.6 % G542X 1.5% PRE REQUISITES Gene loci Size Frequency of known mutations Figure 11.10

9
METHODS MUTATION SCANNING sequencing Direct sequencing Southern blots
dHPLC Microarrays Figure 11.10

10
MUTATION SCANNING Using dHPLC Exon 6 of DMD gene
normal Figure 11.10 affected Fig18.4: HMG3 by Strachan & Read

11
Using multiplex ARMS test
MUTATION SCANNING Using multiplex ARMS test Screening for 29 mutations of the CFTR gene Figure 11.10 Fig18.10: HMG3 by Strachan & Read

12
GENE TRACKING Analysis of linked markers in families for the inheritance of a high risk chromosome from heterozygous parents. Used when map location of disease locus is known but not the actual disease gene The process has 3 steps 1) find a closely linked marker for which the parents are heterozygous 2) work out which chromosome carries the disease allele 3) work out which chromosome the individual has inherited Figure 11.10
![]()
13
POPULATION SCREENING Screening programs for well characterised traits must be both SENSITIVE ACCURATE e.g. PKU tests /Guthrie (PAH activity) ARMS test (CFTR mutations) Figure 11.10
 ARMS test (CFTR mutations) Figure")
14
Forensics Identify crime suspects / exonerate innocent
Identify victims Establish family relationships Identify endangered species Detect pollutants Match organ donor with recipient Determine seed / livestock pedigree Authenticate consummables Figure 11.15

15
Early markers DNA fingerprinting
Karl Landsteiner’s ABO blood typing DNA fingerprinting Originally described by Sir Alec Jeffereys (1985) (Nature, 1985, 316: Jeffereys et al) Discovery of hypervariable loci ‘Differential lysis’ technique in parallel First conviction using DNA fingerprinting was Colin Pitchfork in 1986 ABO proves exclusion Proof of inclusion much more difficult
 (Nature, 1985, 316: Jeffereys et al) Discovery of hypervariable loci. ‘Differential lysis’ technique in parallel. First conviction using DNA fingerprinting was Colin Pitchfork in ABO proves exclusion. Proof of inclusion much more difficult.")
16
Simple sequence repeats (SSRs)
Repetitive sequences… Simple sequence repeats (SSRs) Microsatellites 1-13 bp repeats e.g. (A)n (AC)n Minisatellites bp repeats 3% of genome (dinucleotides - 0.5%) HUMFES/FPS (ATTT)8-14
 Microsatellites bp repeats e.g. (A)n (AC)n. Minisatellites bp repeats. 3% of genome (dinucleotides - 0.5%) HUMFES/FPS (ATTT)8-14.")
17
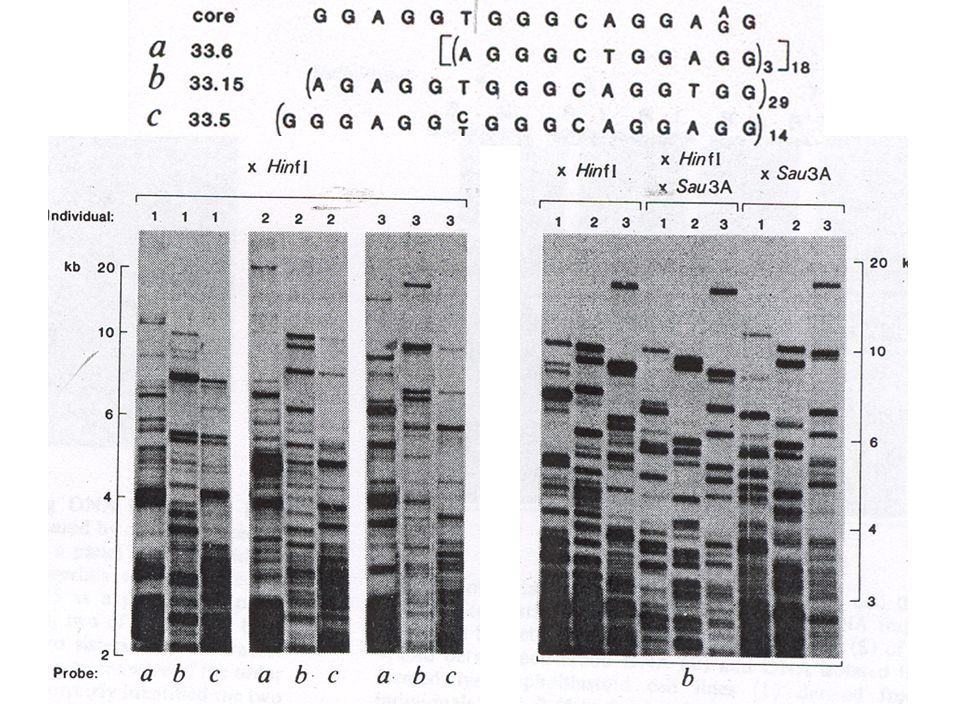
1985 technique using hybridisation of Multi locus probes (MLP)
Minisatellite probes consisting of tandem repeats of the myoglobin locus Number of multiple loci probes (MLP) identified Core sequence GGAGGTGGGCAGGA 2 of these used (33.15 and 33.6) hybridised to Southern Blots of restriction-digested genomic DNA Shared ‘core’ sequences at multiple loci creates hypervariable, multi-band patterns called DNA ‘fingerprints Together, upto 36 independently inherited bands detected 2 probes gave a match probability of <5 x 10-19 ABO proves exclusion Proof of inclusion much more difficult
 identified. Core sequence GGAGGTGGGCAGGA. 2 of these used (33.15 and 33.6) hybridised to Southern Blots of restriction-digested genomic DNA. Shared ‘core’ sequences at multiple loci creates hypervariable, multi-band patterns called DNA ‘fingerprints. Together, upto 36 independently inherited bands detected. 2 probes gave a match probability of <5 x ABO proves exclusion. Proof of inclusion much more difficult.")
19
…now superceded by PCR-based methods
Discovery of STR (short tandem repeats) Use of STR multiplex PCR Autosomal SNP typing, Y-chromosome / mtDNA markers Advantages Increased sensitivity Small sample quantities sufficient Uses microsatellites, instead of minisatellites Multiplex PCR: single tube PCR reaction amplifying multiple loci
 Use of STR multiplex PCR. Autosomal SNP typing, Y-chromosome / mtDNA markers. Advantages. Increased sensitivity. Small sample quantities sufficient. Uses microsatellites, instead of minisatellites. Multiplex PCR: single tube PCR reaction amplifying multiple loci.")
20
How does forensic ID work?
Extract DNA Analyse specific regions using probes look for matches between 2 samples at many loci (multilocus) Scan ~ 10 DNA regions that show locus variability > 5 matches Create DNA profile (DNA fingerprint)
 Scan ~ 10 DNA regions that show locus variability. > 5 matches. Create DNA profile (DNA fingerprint)")
21
Oct 2004, Vol 5 pg739

22
Current methods 1) Autosomal STR typing Needs ~300bp amplicons
SGMPlus database (UK) contains 5 multiplex loci US FBI CODIS contain 13 STR loci An electropherogram of the second-generation multiplex ‘SGM Plus’ profile from a male, including X- and Y-specific amelogenin products of 106 and 112 bp, respectively. Most short tandem repeats (STRs) are heterozygous and the alleles are evenly balanced. Numbers beneath STR peaks indicate allele sizes in repeat units. The STR profile is displayed in the green, blue and yellow channels of a four-colour fluorescent system, with the red channel being used for a size marker (not shown). electropherogram is a plot of fluorescence units over time.
 contains 5 multiplex loci. US FBI CODIS contain 13 STR loci. An electropherogram of the second-generation multiplex ‘SGM Plus’ profile from a male, including X- and Y-specific amelogenin products of 106 and 112 bp, respectively. Most short tandem repeats (STRs) are heterozygous and the alleles are evenly balanced. Numbers beneath STR peaks indicate allele sizes in repeat units. The STR profile is displayed in the green, blue and yellow channels of a four-colour fluorescent system, with the red channel. being used for a size marker (not shown). electropherogram is a plot of fluorescence units over time.")
23
Some STR electropherograms
Electropherogram of a second-generation multiplex ‘SGM Plus’ profile from a male An electropherogram of the second-generation multiplex ‘SGM Plus’ profile from a male, including X- and Y-specific amelogenin products of 106 and 112 bp, respectively. Most short tandem repeats (STRs) are heterozygous and the alleles are evenly balanced. Numbers beneath STR peaks indicate allele sizes in repeat units. The STR profile is displayed in the green, blue and yellow channels of a four-colour fluorescent system, with the red channel being used for a size marker (not shown). electropherogram is a plot of fluorescence units over time. Electropherogram profile from a mixture Mixtures can only be identified if the alleles of the minor component are above the background ‘noise’ in an electropherogram (in practice a ratio of ~1:10)
 are heterozygous and the alleles are evenly balanced. Numbers beneath STR peaks indicate allele sizes in repeat units. The STR profile is displayed in the green, blue and yellow channels of a four-colour fluorescent system, with the red channel. being used for a size marker (not shown). electropherogram is a plot of fluorescence units over time. Electropherogram profile from a mixture. Mixtures can only be identified if the alleles of the minor component are above the background ‘noise’ in an electropherogram (in practice a ratio of ~1:10)")
24
Current methods 2) Autosomal SNP typing
Lower heterozygosities compared to STR (0.5) ~ 50 SNPs need to be typed for low Pm Difficult to resolve mixtures ~50bp template sizes enough
 ~ 50 SNPs need to be typed for low Pm. Difficult to resolve mixtures. ~50bp template sizes enough.")
25
Highest variation in control region (800bp)
Current methods 3) Mitochondrial DNA typing Mutation rate ~1/33 generations Heteroplasmy (original and mutated forms co-exist) More stable for forensic analysis Multicopy 16.5 kbp Maternally inherited Highest variation in control region (800bp)
 Mitochondrial DNA typing. Mutation rate ~1/33 generations. Heteroplasmy (original and mutated forms co-exist) More stable for forensic analysis. Multicopy kbp. Maternally inherited. Highest variation in control region (800bp)")
26
Current methods 4) Y-chromosome typing Haploid
Recombination-deficient (mutations only) Paternal inheritance Binary polymorphisms
 Paternal inheritance. Binary polymorphisms.")
27
Is DNA effective in casework?
Techniques must be robust and reproducible for sample variability Only if used intelligently!! Only regions showing the most variability can be used Must cover large regions Must be validated Look for matches ‘beyond a reasonable doubt’

28
Is DNA effective in casework?
evidential weight of a match between crime stain profile and suspect is quantified by the match probability (Pm) Strength of evidence based on likelihood ratio (LR) LR = C / C ‘Prosecutor’s fallacy’ or ‘fallacy of the transposed conditional’ ‘The probability of the DNA evidence, if it came from the suspect, is 1 in 50 million’ The evidential weight of a match between crime stain profile and suspect is quantified by the match probability (Pm); the chance of two unrelated people sharing a profile. For independently inherited loci,Pm is calculated by multiplying the individual allele frequencies in the profile in question (the ‘product rule’): the greater the number of loci, and the greater the heterozygosity of each locus, the lower the value of Pm.However, there are a number of situations in which Pm can be substantially increased: • if the profile is partial because of degradation, reducing the number of informative loci; • if a suspect and a perpetrator share many alleles by descent (for example, are brothers); • if a suspect and a perpetrator originate from the same subpopulation. POPULATION STRUCTURE can cause frequencies of alleles (and hence profiles) to vary between subpopulations — an issue that caused great controversy in the application of SLP profiling90. The debate was resolved by applying guidelines to ensure match probabilities quoted in court were conservative (that is, favourable to the defendant). Similar conservatism is now applied to STR profiles91.
 Strength of evidence based on likelihood ratio (LR) LR = C / C. ‘Prosecutor’s fallacy’ or ‘fallacy of the transposed conditional’ ‘The probability of the DNA evidence, if it came from the suspect, is 1 in 50 million’ The evidential weight of a match between crime stain profile and suspect is quantified by the match probability (Pm); the chance of two unrelated people sharing a profile. For independently inherited loci,Pm is calculated by multiplying. the individual allele frequencies in the profile in question (the ‘product rule’): the greater the number of loci, and the. greater the heterozygosity of each locus, the lower the value of Pm.However, there are a number of situations in which. Pm can be substantially increased: • if the profile is partial because of degradation, reducing the number of informative loci; • if a suspect and a perpetrator share many alleles by descent (for example, are brothers); • if a suspect and a perpetrator originate from the same subpopulation. POPULATION STRUCTURE can cause frequencies of alleles (and hence profiles) to vary between subpopulations — an issue. that caused great controversy in the application of SLP profiling90. The debate was resolved by applying guidelines to. ensure match probabilities quoted in court were conservative (that is, favourable to the defendant). Similar conservatism. is now applied to STR profiles91.")
31
(A) PATERNITY TEST (B) RAPE CASE Figure 11.15
 PATERNITY TEST (B) RAPE CASE Figure 11.15")
32
DNA fingerprints can identify individuals and determine parentage
E.g., DNA fingerprints confirmed Dolly the sheep was cloned from an adult udder cell Donor udder (U), cell culture from udder (C), Dolly’s blood cell DNA (D), and control sheep 1-12 Figure 11.15 Fig Hartwell
, cell culture from udder (C), Dolly’s blood cell DNA (D), and control sheep Figure Fig Hartwell.")
34
References Hum Mol Gen 3 by Strachan and Read Chapter 18
Hartwell et al – Chapter 11; pages DNA profiling in forensics by Peter Gill et al

Similar presentations


 Molecular Medicine 2) Energy sources and environmental applications 3) Risk assessment 4) Bioarchaeology,>")


>")
>")


 The order of the base pairs in the sequence of every human varies In a single.>")
 Power of Discrimination (Genetics) Low High SlowFast Markers Used (Biology) RFLP Single Locus Probes RFLP Multi-Locus.>")


 Bioarchaeology, anthropology, human evolution, human migration.>")


 unique Most DNA is highly conservative from one person to the next A few small domains (0.1%)>")