Download presentation
Presentation is loading. Please wait.

1
The concept of Diabetes & CV risk: A lifetime risk challenge
Cardio Diabetes Master Class European chapter Munich, Germany May 6-8, 2011 Presentation topic Targeting Blood Pressure : What are the Optimal Targets in CV Risk and Diabetes? Slide lecture prepared and held by: Gordon McInnes, MD Professor of Clinical Pharmacology University of Glasgow, Western Infirmary Glasgow, United Kingdom

2
Global Mortality 2000: Impact of Correctable Risk Factors
PACE Munich 2011 Global Mortality 2000: Impact of Correctable Risk Factors High BP Tobacco High cholesterol Underweight Unsafe sex High BMI Physical inactivity Developing region Developed region This slide highlights the contribution of some of the leading health risk factors to global mortality, e.g. high BP, tobacco use, high cholesterol, and under-nutrition. In both developed and developing regions, high BP was among the major causes of disease burden and a leading cause of global mortality. Intensive strategies to target leading global health risk factors such as hypertension are therefore necessary. Reference Ezzati M, et al. Selected major risk factors and global and regional burden of disease. Lancet 2002;360:1347–60. Alcohol 1 2 3 4 5 6 7 8 Attributable mortality in millions (total: 55,861,000) Adapted from The Lancet, 360, Ezzati et al. pp. 1347–60. Copyright © 2002, with permission from Elsevier PACE Munich 2011 2
 Adapted from The Lancet, 360, Ezzati et al. pp. 1347–60. Copyright © 2002, with permission from Elsevier. PACE Munich")
3
CHD mortality rate in each decade of age
PACE Munich 2011 Meta-analysis of individual Blood Pressure data for 1million adults in 61 prospective studies Prospective Studies Collaboration Lancet CHD mortality rate in each decade of age versus usual blood pressure at the start of that decade PACE Munich 2011 3

4
Diabetes – CHD Risk Equivalent
British Regional Heart Study Risk of major CHD event No MI or diabetes Diabetes diagnosed > 60 years 1.54 Diabetes diagnosed < 60 years 2.39 Prior MI Wannamethee SG et al, Arch Intern Med 2011; 171:

5
PACE Munich 2011 Benefits of antihypertensive treatment proportional to reduction in blood pressure Systolic blood pressure difference between randomised groups (mmHg) Relative risk of stroke CA/plac ACE/plac More/less ARB/other ACE/CA CA/DBB ACE/DBB Results of prospectively-designed overviews of randomised trials. Lancet 2003; 362: PACE Munich 2011
 Relative risk of stroke. CA/plac. ACE/plac. More/less. ARB/other. ACE/CA. CA/DBB. ACE/DBB. Results of prospectively-designed overviews of randomised trials. Lancet 2003; 362: PACE Munich")
6
Benefits of Antihypertensive Treatment Absolute Risk Reduction

7
UKPDS : Tight Glucose vs Tight BP Control and CV Outcomes in UKPDS
PACE Munich 2011 UKPDS : Tight Glucose vs Tight BP Control and CV Outcomes in UKPDS Stroke Any Diabetic Endpoint DM Deaths Microvascular Complications 5% 10% -10 12% -20 24% Diabetes: Tight Glucose vs Tight BP Control and CV Outcomes in UKPDS Talking Points: A comparison of tight glucose control, HbA1c=7% (achieved was 8.2%) vs tight blood pressure control <150/85 mmHg (achieved 144/82 mmHg) revealed that blood pressure reduction contributed to a greater extent to the relative reduction of cardiovascular events. References: Tight blood pressure control and risk of macrovascular and microvascular complications in type 2 diabetes: UKPDS 38. UK Prospective Diabetes Study Group. BMJ. 1998;317(7160): Efficacy of atenolol and captopril in reducing risk of macrovascular and microvascular complications in type 2 diabetes: UKPDS 39. UK Prospective Diabetes Study Group. BMJ. 1998;317(7160): * -30 % Reduction In Relative Risk 32% 32% * 37% *P <0.05 compared to tight glucose control -40 * 44% * Tight Glucose Control (Goal <6.0 mmol/l or 108 mg/dL) Tight BP Control (Average 144/82 mmHg) -50 UKPDS 1998 PACE Munich 2011 7
 vs tight blood pressure control <150/85 mmHg (achieved 144/82 mmHg) revealed that blood pressure reduction contributed to a greater extent to the relative reduction of cardiovascular events. References: Tight blood pressure control and risk of macrovascular and microvascular complications in type 2 diabetes: UKPDS 38. UK Prospective Diabetes Study Group. BMJ. 1998;317(7160): Efficacy of atenolol and captopril in reducing risk of macrovascular and microvascular complications in type 2 diabetes: UKPDS 39. UK Prospective Diabetes Study Group. BMJ. 1998;317(7160): * -30. % Reduction In Relative Risk. 32% 32% * 37% *P <0.05 compared to tight glucose control * 44% * Tight Glucose Control. (Goal <6.0 mmol/l or 108 mg/dL) Tight BP Control. (Average 144/82 mmHg) -50. UKPDS PACE Munich")
8
HOT Study: Effects of blood pressure on cardiovascular events
PACE Munich 2011 HOT Study: Effects of blood pressure on cardiovascular events Minimum blood pressures around which the maximum benefits of treatment can be expected are systolic between 130mmHg-140mmHg diastolic between 80mmHg- 85mmHg Between 5-10 cardiovascular events can be prevented in every 1000 patients successfully treated for 1 year Conclusion: The principal results of the HOT Study demonstrate the benefits of lowering blood pressure in patients with hypertension to 140mm Hg systolic and 85 mm Hg diastolic, or lower. Efforts to lower blood pressure further, down to 120mm Hg systolic and 70mm Hg diastolic, appear to give little further benefit, but do not cause any significant additional risk. Active lowering of blood pressure was particularly beneficial in the subgroup of patients with diabetes mellitus. Quote “The HOT study is a triumph in that the diastolic blood pressure was reduced by over 20mm Hg in most of the nearly 19,000 patients, far beyond the average 5-6mm Hg reductions achieved in many other randomised controlled trials” Lancet 1998; 351: 1748–1753 -Commentary Norman Kaplan, University of Texas Hansson L, et al. Lancet 1998;351: PACE Munich 2011

10
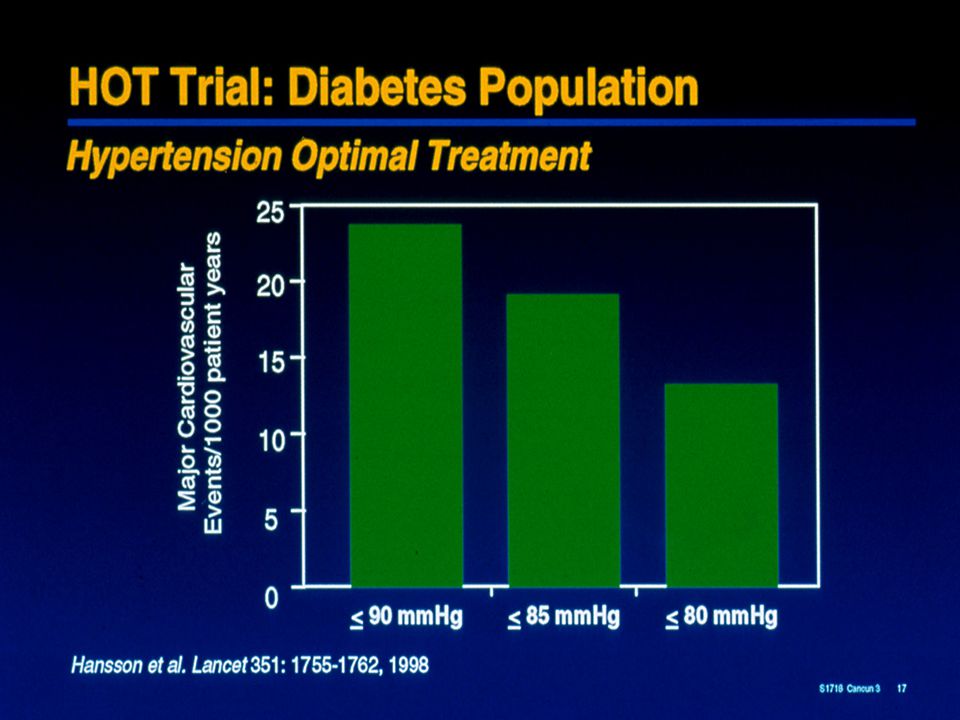
Hypertension Optimal Treatment (HOT) Study
PACE Munich 2011 Hypertension Optimal Treatment (HOT) Study Intensive BP-lowering decreases cardiovascular risk in patients with hypertension, especially among those with diabetes Major CV events per 1000 patient years 30 24.4 25 All patients (n=18 790) Diabetics (n=1501) 20 18.6 15 11.9 9.9 10.0 10 9.3 5 90 mm Hg 85 mm Hg 80 mm Hg Target DBP group Lancet 1998;351:1755–1762 PACE Munich 2011
 Study. Intensive BP-lowering decreases cardiovascular risk in patients with hypertension, especially among those with diabetes. Major CV events per 1000 patient years All patients (n=18 790) Diabetics (n=1501) 90 mm Hg. 85 mm Hg. 80 mm Hg. Target DBP group. Lancet 1998;351:1755–1762. PACE Munich")
11
UKPDS: Microvascular Endpoints, MI, and SBP
PACE Munich 2011 8.Reducing CV risk in diabetes.Multifactorial approach.Prof J Betteridge.pptx - 20 May 2009 UKPDS: Microvascular Endpoints, MI, and SBP Incidence of microvascular endpoints and MI by updated mean SBP* Adjusted for age, sex, and ethnic group Expressed for white men, 50–54 years old at baseline and with mean diabetes duration of 10 years 50 MI Microvascular endpoints 40 30 Adjusted incidence per patient years (%) 20 10 UKPDS data were used to evaluate the relationship between systolic blood pressure (SBP) over time and the development of macrovascular and microvascular complications. SBP was measured at baseline and as an updated mean of annual measurements, calculated for each year of follow-up (i.e., average of the baseline and all available annual levels).25 The slide shows results, adjusted for age, sex, and ethnic group, for men 50 to 54 years old with a mean diabetes duration of 10 years at baseline. The risk of both macrovascular (MI) and microvascular complications of type 2 diabetes was strongly associated with increasing SBP. There was no evidence of a threshold effect.25 110 120 130 140 150 160 170 *Updated mean SBP = average of the baseline and all available annual measurements SBP = systolic blood pressure Updated mean SBP (mmHg)* Adler et al BMJ 2000;321: 8.Reducing CV risk in diabetes.Multifactorial approach.Prof J Betteridge.pptx - 20 May 2009 PACE Munich 2011 11 11
 UKPDS data were used to evaluate the relationship between systolic blood pressure (SBP) over time and the development of macrovascular and microvascular complications. SBP was measured at baseline and as an updated mean of annual measurements, calculated for each year of follow-up (i.e., average of the baseline and all available annual levels).25. The slide shows results, adjusted for age, sex, and ethnic group, for men 50 to 54 years old with a mean diabetes duration of 10 years at baseline. The risk of both macrovascular (MI) and microvascular complications of type 2 diabetes was strongly associated with increasing SBP. There was no evidence of a threshold effect *Updated mean SBP = average of the baseline and all available annual measurements. SBP = systolic blood pressure. Updated mean SBP (mmHg)* Adler et al BMJ 2000;321: Reducing CV risk in diabetes.Multifactorial approach.Prof J Betteridge.pptx - 20 May PACE Munich")
12
Reduced blood pressure slows the rate of GFR decline
PACE Munich 2011 Reduced blood pressure slows the rate of GFR decline Mean arterial pressure (mmHg) 95 98 101 104 107 110 113 116 119 -2 r = 0.69; P < 0.05 -4 -6 This meta-analysis of clinical trials in diabetic and non-diabetic renal disease shows the direct and continuous relationship between the achieved blood pressure and the decline in GFR.1 In patients with proteinuria >1 g/day and renal insufficiency (GFR 13–55 mL/min/1.73 m2), optimal blood pressure is <125/75 mmHg.2 Bakris GL, et al. Preserving renal function in adults with hypertension and diabetes: a consensus approach. Am J Kidney Dis 2000;36:646–661. Lazarus JM, et al. Achievement and safety of a low blood pressure goal in chronic renal disease. The Modification of Diet in Renal Disease Study Group. Hypertension 1997;29:641–650. Decline in GFR (mL/min/year) Untreated hypertension -8 -10 -12 130/85 140/90 -14 Bakris et al. Am J Kidney Dis 2000;36:646–661 PACE Munich 2011
 r = 0.69; P < This meta-analysis of clinical trials in diabetic and non-diabetic renal disease shows the direct and continuous relationship between the achieved blood pressure and the decline in GFR.1. In patients with proteinuria >1 g/day and renal insufficiency (GFR 13–55 mL/min/1.73 m2), optimal blood pressure is <125/75 mmHg.2. Bakris GL, et al. Preserving renal function in adults with hypertension and diabetes: a consensus approach. Am J Kidney Dis 2000;36:646–661. Lazarus JM, et al. Achievement and safety of a low blood pressure goal in chronic renal disease. The Modification of Diet in Renal Disease Study Group. Hypertension 1997;29:641–650. Decline in GFR (mL/min/year) Untreated. hypertension / / Bakris et al. Am J Kidney Dis 2000;36:646–661. PACE Munich")
13
More Versus Less Intensive BP Control Meta-analysis : RR
DM No DM All BP diff 6.0/ /3.3 Stroke CHD HF Major CV event CV deaths Total mortality BPLTTC, Arch Intern Med 2005; 165:

14
Blood Pressure Targets
Uncomplicated DM CRF US (2003 ) < 140/ < 130/ < 130/80 Europe (2007) < 140/ < 130/ < 130/80 WHO/ISH (2004) SBP < < 130/ < 130/80 UK (2004) < 140/ < 130/ < 130/80 China (2005) < 140/ < 130/ < 130/80
 < 140/90 < 130/80 < 130/80. Europe (2007) < 140/90 < 130/80 < 130/80. WHO/ISH (2004) SBP < 140 < 130/80 < 130/80. UK (2004) < 140/85 < 130/80 < 130/80. China (2005) < 140/90 < 130/80 < 130/80.")
15
Incidence (%) of MI or Stroke
INVEST: Incidence of Myocardial Infarction (MI) and Stroke by Diastolic Blood Pressure Strata DBP (mm Hg) 25 30 20 15 10 5 ≤60 >60 to ≤70 >70 to ≤80 >80 to ≤90 >90 to ≤100 >100 to ≤110 >110 Incidence (%) of MI or Stroke 35 MI Stroke Messerli FH et al Ann Intern Med 2006; 144:
 and Stroke by Diastolic Blood Pressure Strata. DBP (mm Hg) ≤60. >60 to. ≤70. >70 to. ≤80. >80 to. ≤90. >90 to. ≤100. >100 to. ≤110. >110. Incidence (%) of MI or Stroke. 35. MI. Stroke. Messerli FH et al Ann Intern Med 2006; 144:")
16
ESH guidelines - Reappraisal
Rigorous control of BP (< 130 mmHg) in diabetes or prior CV disease not supported by trial evidence J-curve phenomenon unlikely except perhaps in advanced occlusive disease Mancia G, Blood Pressure 2009
 in diabetes or prior CV disease not supported by trial evidence. J-curve phenomenon unlikely except perhaps in advanced occlusive disease. Mancia G, Blood Pressure")
17
Recommendations for BP Goals
Nairobi Meeting_Showfile_20 Sept 2010.pptx - 23 September 2010 PACE Munich 2011 Recommendations for BP Goals BHS-IV1 ESH-ESC2 Type of hypertension BP goal (mmHg) Uncomplicated <140/85 130–139/80–85 Complicated Diabetes mellitus <130/80 Kidney disease <130/80* Other high risk (stroke, myocardial infarction) Based on published evidence, the ESHESC guidelines1 and the JNC 7 guidelines2 have made recommendations for target BP goals that should be achieved in order to maximize the reduction in the long-term risk of cardiovascular (CV) disease and death. In the US JNC7 guidelines, target BP goals are <130/80 mmHg for patients with hypertension complicated by diabetes or renal disease. The same is true for those patients considered high risk (e.g. history of stroke or previous myocardial infarction). A re-appraisal of the ESH-ESC guidelines has suggested BP goals of 130–139/80–85 mmHg for these patients.1 Achievement of BP goals is thought to be particularly necessary for such patients because the presence/history of these diseases may compound their total CV risk. References 1. Mancia G, et al. Reappraisal of European guidelines on hypertension management: a European Society of Hypertension Task Force document. Blood Pressure 2009;18:308–347. 2. Chobanian AV, et al. Seventh report of the Joint National Committee on prevention, detection, evaluation, and treatment of high blood pressure. Hypertension 2003;42:1206–1252. *Lower if proteinuria is >1 g/day 1. Williams B et al J Human Hypertension Mancia et al. Blood Pressure 2009 Valsartan Family Scientific Slide Resource Item code: DIO10.168; Release Date: May 2010 PACE Munich 2011 Nairobi Meeting_Showfile_20 Sept 2010.pptx - 23 September 2010 17
 Uncomplicated. <140/ –139/80–85. Complicated. Diabetes mellitus. <130/80. Kidney disease. <130/80* Other high risk (stroke, myocardial infarction) Based on published evidence, the ESHESC guidelines1 and the JNC 7 guidelines2 have made recommendations for target BP goals that should be achieved in order to maximize the reduction in the long-term risk of cardiovascular (CV) disease and death. In the US JNC7 guidelines, target BP goals are <130/80 mmHg for patients with hypertension complicated by diabetes or renal disease. The same is true for those patients considered high risk (e.g. history of stroke or previous myocardial infarction). A re-appraisal of the ESH-ESC guidelines has suggested BP goals of 130–139/80–85 mmHg for these patients.1 Achievement of BP goals is thought to be particularly necessary for such patients because the presence/history of these diseases may compound their total CV risk. References. 1. Mancia G, et al. Reappraisal of European guidelines on hypertension management: a European Society of Hypertension Task Force document. Blood Pressure 2009;18:308– Chobanian AV, et al. Seventh report of the Joint National Committee on prevention, detection, evaluation, and treatment of high blood pressure. Hypertension 2003;42:1206–1252. *Lower if proteinuria is >1 g/day. 1. Williams B et al J Human Hypertension Mancia et al. Blood Pressure Valsartan Family Scientific Slide Resource Item code: DIO10.168; Release Date: May PACE Munich Nairobi Meeting_Showfile_20 Sept 2010.pptx - 23 September")
18
18 ADVANCE: Primary Outcomes Combined Macro & Microvascular Events
PACE Munich 2011 ADVANCE: Primary Outcomes number of events Per-Indap (n=5569) Placebo (n=5571) RR reduction (95%CI) Combined Macro & Microvascular Events 9% (0 to 17%) 861 938 Macrovascular Events 480 520 8% (-4 to 19%) Microvascular Events 439 477 9% (-4 to 20%) favours per-indap favours placebo 0.5 1.0 2.0 Hazard Ratio Average BP during follow-up 140.3 / 77.0 mmHg Placebo 137.4 / 74.8 mmHg Peridopril-Indapamide ADVANCE Collaborative Group 2007 PACE Munich 2011 18
 Placebo. (n=5571) RR reduction. (95%CI) Combined Macro & Microvascular Events. 9% (0 to 17%) Macrovascular Events % (-4 to 19%) Microvascular Events % (-4 to 20%) favours per-indap. favours placebo Hazard Ratio. Average BP during follow-up / 77.0 mmHg Placebo / 74.8 mmHg Peridopril-Indapamide. ADVANCE Collaborative Group PACE Munich")
19
ADVANCE & ACCORD in context - UKPDS
PACE Munich 2011 ADVANCE & ACCORD in context - UKPDS Incidence of myocardial infarction & microvascular end points by mean systolic BP, adjusted for age, sex, & ethnic group expressed for white men aged 5054 yrs at diagnosis & mean duration of diabetes of 10 yrs 50 ACCORD ADVANCE UKPDS 40 Myocardial Infarction 30 Microvascular Endpoints incidence/1000patient. yrs (%) This relates the study population in the ACCORD Trial to that of UKPDS and ADVANCE 20 10 110 120 130 140 150 160 170 mean systolic BP (mmHg) UKPDS 36: 2000 PACE Munich 2011
 This relates the study population in the ACCORD Trial to that of UKPDS and ADVANCE mean systolic BP (mmHg) UKPDS 36: PACE Munich")
20
Risk of Stroke in DM or Impaired FBS
Messerli FH, Bangalore S JACC 2011; 57:

Similar presentations

 Randomisation Avoid ACE inhibitors/ beta-blockers (n = 390) Tight BP control (n =>")
>")


60104-X Efficacy and safety of cholesterol-lowering treatment: prospective meta-analysis of data from.>")


