Download presentation
Presentation is loading. Please wait.

1
Consorzio Interuniversitario Nazionale per la Bio-Oncologia Dott.ssa Alessandra Santomaggio Oncologia medica P.O. San Salvatore Università Degli Studi DellAquila 28 novembre 2008

2
la tossicità del 5-FU è maggiore nellanimale da laboratorio quando lanimale è nella fase di attività rispetto alla fase di riposo incremento della attività a metà notte, nelle cellule mononucleate periferiche dell'uomo, della diidropirimidina deidrogenasi (DPD) riduzione nell'uomo, della sintesi del DNA da parte delle cellule del midollo osseo e della mucosa orale e gastrointestinale, nella prima metà della notte (tra le ore 24.00 e le ore 4.00) rispetto alla prima metà della fase di attività
 riduzione nell uomo, della sintesi del DNA da parte delle cellule del midollo osseo e della mucosa orale e gastrointestinale, nella prima metà della notte (tra le ore e le ore 4.00) rispetto alla prima metà della fase di attività")
3
Chronomodulated versus fixed-infusion-rate delivery of ambulatory chemotherapy with oxaliplatin, fluorouracil, and folinic acid (leucovorin) in patients with colorectal cancer metastases: a randomized multi-institutional trial. Levi FA, Zidani R, Vannetzel JM, Perpoint B, Focan C, Faggiuolo R, Chollet P, Garufi C, Itzhaki M, Dogliotti L, et al. J Natl Cancer Inst. 1994 Nov 2;86(21):1608-17. CRONOFLAT 5-FU 600-700; l-OHP 20-25; AF 300 5 gg 3 w 5-FU 600-700; l-OHP 20-25; AF 300 5 gg 3 w 45 patients47 patients G3-4 Stomatitis 18%G3-4 Stomatitis 89% HF s. 4%HF s. 11% 5-FU median dose 7005-FU median dose 500 RR 53%; TTP 11; OS 19RR 32%; TTP 8; OS 14.9
: CRONOFLAT 5-FU ; l-OHP 20-25; AF gg 3 w 5-FU ; l-OHP 20-25; AF gg 3 w 45 patients47 patients G3-4 Stomatitis 18%G3-4 Stomatitis 89% HF s. 4%HF s. 11% 5-FU median dose 7005-FU median dose 500 RR 53%; TTP 11; OS 19RR 32%; TTP 8; OS")
4
CRONOFLAT 5-FU 700; l-OHP 25; AF 300 5 gg 3 w 5-FU 700; l-OHP 25; AF 300 5 gg 3 w 93 pazienti G3-4 Stomatitis § 14%G3-4 Stomatitis § 76% Neurotoxicity 16%Neurotoxicity 31% 5-FU median dose 7005-FU median dose 500 RR 51%*; TTP 10; OS 16RR 29%*; TTP 8; OS 17 Randomised multicentre trial of chronotherapy with oxaliplatin, fluorouracil, and folinic acid in metastatic colorectal cancer. International Organization for Cancer Chronotherapy. Levi F, Zidani R, Misset JL. Lancet. 1997 Sep 6;350(9079):681-6. * p 0,003 § p < 0.0001
: * p 0,003 § p <")
5
4 AM 10 AM 10 PM 4 PM 5-FU 22-h continous infusion 5-FU bolus 5-FU 2800 mg/mq 46-h continous infusion LVLV LVLV LVLV 5-FU continous infusion 12-h Timed Flat Infusion TFI/5-FU

7
1 2 3 4 CPT-11 180 mg/m 2 5-FU 600-1200 mg/m 2 /d h day 22 10 22 10 22 10 22 10 15 16 17 18 CPT-11 180 mg/m 2 Ficorella C Oncol Rep 2006 22 10 22 10 22 10 22 10

11
As Treated analysis (%) n. assessable patients 24/33 CR 3 (12,5) PR 6 (25) SD 5 (21) PD 10 (41,5) AsT Overall Response Rate (ORR) 37,5% (α0.05; CI 20) AsT Disease Control Rate 58,5%
 PR 6 (25) SD 5 (21) PD 10 (41,5) AsT Overall Response Rate (ORR) 37,5% (α0.05; CI 20) AsT Disease Control Rate 58,5%.")
12
12 At median follow-up of 17 months, we observed: Median Time to Progression (TTP)* 10 months (Range months 2-28+) Median Overall Survival (OS)* 25 months (Range months 3 - 42) *calculated with method of Kaplan and Meier
* 10 months (Range months 2-28+) Median Overall Survival (OS)* 25 months (Range months ) *calculated with method of Kaplan and Meier")
14
As Treated analysis (%) n. assessable patients 37/52 CR 3 (8) PR 12 (32) SD 12 (32) PD 10 (28) AsT Overall Response Rate (ORR) 40% (α0.05; CI 16) AsT Disease Control Rate 72%
 PR 12 (32) SD 12 (32) PD 10 (28) AsT Overall Response Rate (ORR) 40% (α0.05; CI 16) AsT Disease Control Rate 72%.")
15
15 At median follow-up of 19 months, we observed: Median Time to Progression (TTP)* 10 months (Range months 2-32+) Median Overall Survival (OS)* 21 months (Range months 3 – 47+) *calculated with method of Kaplan and Meier
* 10 months (Range months 2-32+) Median Overall Survival (OS)* 21 months (Range months 3 – 47+) *calculated with method of Kaplan and Meier")
16
La migliore tollerabilità di L-OHP si verifica a 16 HALO (hours after light onset) negli animali trattati
 negli animali trattati")
17
4 AM 10 AM 10 PM 4 PM 5-FU 22-h continous infusion 5-FU bolus 5-FU 2800 mg/mq 46-h continous infusion LVLV LVLV LVLV 5-FU continous infusion 12-h Timed Flat Infusion TFI/5-FUl-OHP

18
22 10 22 10 1 2 CPT-11 180 mg/m 2 5-FU 800-1300 mg/m 2 /d h day 15 22 10 22 10 8 9 l-OHP 70-80 mg/m 2 22 10 22 10 15 16 CPT-11 180 mg/m 2 15 15 22 10 22 10 22 23 l-OHP 70-80 mg/m 2 Submitted

19
Total N. (%) No. of patients 36 Sex M/F 22/14 Age, years median range > 65 years 62 39-74 14 (39) WHO Performance Status 0 1-2 30 (83) 6 (17) Primary tumor colon rectum 26 (72) 10 (28) No. of involved sites 1 2 26 (72) 10 (28) Sites of metastases liver lung lynph nodes local Other 22 (61) 8 (22) 7 (19) 4 (11) 6 (17) Liver metastases single Multiple 3 (8) 19 (53) Previous adjuvant chemotherapy: FA/5-FU bolus 5-FU bolus + i.c. Irinotecan/5FU 9 (25) 6 (17) 2 (6) 1 (3) Previous radiotherapy: RT alone RT+CT (5-FU i.c.) 2 (6) - 2 (6)
 WHO Performance Status (83) 6 (17) Primary tumor colon rectum 26 (72) 10 (28) No. of involved sites (72) 10 (28) Sites of metastases liver lung lynph nodes local Other 22 (61) 8 (22) 7 (19) 4 (11) 6 (17) Liver metastases single Multiple 3 (8) 19 (53) Previous adjuvant chemotherapy: FA/5-FU bolus 5-FU bolus + i.c. Irinotecan/5FU 9 (25) 6 (17) 2 (6) 1 (3) Previous radiotherapy: RT alone RT+CT (5-FU i.c.) 2 (6) - 2 (6).")
20
Dose levels CPT11 (mg/m 2 d1,15)- l-OHP (mg/m 2 d8,22)- 5-FU (mg/m 2 /d d1-2, 8-9, 15- 16, 22-23) No. patients a (new patients) No. cycles No. Patients with DLT b /total patients (%) No. New patients with DLT/new patients (%) No. cycles with DLT/total cycles (%) DLTs I180-70-700 2 (2) 2---- II180-70-800 3 (1) 3---- III180-70-900 3 (0) 3---- IV180-80-900 7 (4) 121/7 (14%)-1 (8%)G3 Diarrhea V180-80-1000 11 (6) 30 3/11 (27%) 3/6 (50%)3 (10%) G3 Diarrhea G1 Fever with delay > 2 weeks G3 Hypotension a intra- and inter-patient dose escalation ( Simon R. et al., JNCI 1997) b dose-limiting toxicity
 No. cycles No. Patients with DLT b /total patients (%) No. New patients with DLT/new patients (%) No. cycles with DLT/total cycles (%) DLTs I (2) II (1) III (0) IV (4) 121/7 (14%)-1 (8%)G3 Diarrhea V (6) 30 3/11 (27%) 3/6 (50%)3 (10%) G3 Diarrhea G1 Fever with delay > 2 weeks G3 Hypotension a intra- and inter-patient dose escalation ( Simon R. et al., JNCI 1997) b dose-limiting toxicity.")
21
Adverse events NCI-CTC grade (%) per Cycles NCI-CTC grade (%) per Patients 12341234 Nausea 30 (24) 12 (9,5) -- 10 (43) 6 (26) -- Vomiting 13 (10) 11 (9) -- 7 (30) 6 (26) -- Diarrhea 18 (14) 18 (14) 11 (9) - 3 (13) 8 (35) 8 (35) - Stomatitis 16 (13) 1 (1) -- 6 (26) 2 (9) -- Asthenia 33 (26) 16 (13) 1 (1) - 9 (39) 9 (39) 1 (4) - Neurotoxicity 54 (43) 6 (5) 1 (1) - 14 (61) 2 (9) 1 (4) -
 per Cycles NCI-CTC grade (%) per Patients Nausea 30 (24) 12 (9,5) (43) 6 (26) -- Vomiting 13 (10) 11 (9) -- 7 (30) 6 (26) -- Diarrhea 18 (14) 18 (14) 11 (9) - 3 (13) 8 (35) 8 (35) - Stomatitis 16 (13) 1 (1) -- 6 (26) 2 (9) -- Asthenia 33 (26) 16 (13) 1 (1) - 9 (39) 9 (39) 1 (4) - Neurotoxicity 54 (43) 6 (5) 1 (1) - 14 (61) 2 (9) 1 (4) -")
22
Adverse events NCI-CTC grade (%) per Cycles NCI-CTC grade (%) per Patients 12341234 Anemia 13 (10) 3 (2) -- 5 (22) 3 (13) -- Leucopenia 19 (15) 17 (13) -- 3 (13) 8 (35) - 1 (4) Neutropenia 10 (8) 21 (17) 7 (5.5) 1 (1) 3 (13) 6 (26) 3 (13) 1 (4) Thrombocytopenia 10 (8) 4 (3) -- 3 (13) 3 (13) --
 per Cycles NCI-CTC grade (%) per Patients Anemia 13 (10) 3 (2) -- 5 (22) 3 (13) -- Leucopenia 19 (15) 17 (13) -- 3 (13) 8 (35) - 1 (4) Neutropenia 10 (8) 21 (17) 7 (5.5) 1 (1) 3 (13) 6 (26) 3 (13) 1 (4) Thrombocytopenia 10 (8) 4 (3) -- 3 (13) 3 (13) --")
23
Intention to treat analysis (%) Assessable patients (%) n. patients 3330 CR 2 (6) 2 (6.7) PR 21 (63.6) 18 (60) SD 3 (9) 3 (10) PD 7 (21.2) 7 (23.3) ITT Overall Response Rate (ORR) 69.6% (α0.05; CI 16) ITT Disease Control Rate 78.6% AsT Overall Response Rate (ORR) 66.7% (α0.05; CI 17) AsT Disease Control Rate 76.7%
 2 (6.7) PR 21 (63.6) 18 (60) SD 3 (9) 3 (10) PD 7 (21.2) 7 (23.3) ITT Overall Response Rate (ORR) 69.6% (α0.05; CI 16) ITT Disease Control Rate 78.6% AsT Overall Response Rate (ORR) 66.7% (α0.05; CI 17) AsT Disease Control Rate 76.7%.")
24
24 With a median follow-up of 19 months (range 1-31), we observed: Median Time to Progression (TTP)* 12 months (Range months 3+ - 61+) Median Overall Survival (OS)* 20 months (Range months 3+ - 61+) *calculated with method of Kaplan and Meier
, we observed: Median Time to Progression (TTP)* 12 months (Range months ) Median Overall Survival (OS)* 20 months (Range months ) *calculated with method of Kaplan and Meier")
25
AutoreFasePts PDI CPT-11 mg/m 2 /w PDI OXP mg/m 2 /w PDI 5-FU mg/m 2 /w LV mg/m 2 G3-4 diarrea (% of pts) Neutropenia febbrile (% of pts) RR % Falcone 2002 I4287,5501900 48h ic200211471.4 Ychou 2003 I349042,5 400 b + 600 22 h ic or 400 b +2400 46 h ic 200 or 400 25-2825-14-* Goetz 2003 I3550 or 5817 or 28213 b or 320 b2016,6--* Abad 2004 I187542,51125 48 h ic-33-77 Cals 2004 I3440322400 24 h ic--16,650 # Gil-Delgado 2004 I349042,5 400 b + 600 22 h ic 20012,5 44 Present Study I-II299040 1800 TFI -37,5-57 Bécourarm 2001 II324521,2 400 b + 600 22h ic 20019136#6# Calvo 2002 II2662,5301300 24 h ic50034,5-69.2 Souglakos 2002 II317532,5 400 b + 600 22h ic 20032658.1 Garufi 2003 II356026.7 § 933 § 150 § 28-22.9 # Rosati 2004 II404432,5 1150 or 900 48 h ic 15072,2-57.5 Masi 2004 II3282,542,51600 48 h ic200163472
 Neutropenia febbrile (% of pts) RR % Falcone 2002 I4287, h ic Ychou 2003 I349042,5 400 b h ic or 400 b h ic 200 or * Goetz 2003 I3550 or 5817 or b or 320 b2016,6--* Abad 2004 I187542, h ic Cals 2004 I h ic--16,650 # Gil-Delgado 2004 I349042,5 400 b h ic 20012,5 44 Present Study I-II TFI -37,5-57 Bécourarm 2001 II324521,2 400 b h ic #6# Calvo 2002 II2662, h ic50034, Souglakos 2002 II317532,5 400 b h ic Garufi 2003 II § 933 § 150 § # Rosati 2004 II404432, or h ic 15072, Masi 2004 II3282,542, h ic")
26
22 10 22 10 1 2 CPT-11 160 mg/m 2 Bevacizumab 5 mg/kg 5-FU 900 mg/m 2 /d h day 15 22 10 22 10 8 9 l-OHP 60-70-80 mg/m 2 22 10 22 10 15 16 CPT-11 160 mg/m 2 Bevacizumab 5 mg/kg 15 22 10 22 10 22 23 l-OHP 60-70-80 mg/m 2

27
Total N. (%) No. of patients 46 Sex M/F28/18 Age, years median range > 65 years 64 40-73 23 (50) WHO Performance Status 0 1-2 44 (96) 2 (4) Primary tumor colon rectum 22 (48) 24 (52) No. of involved sites 1 2 26 (57) 20 (43) Sites of metastases liver lung lynph nodes local Other 31 (67) 11 (24) 17 (37) 9 (19) 5 (11) Liver metastases single Multiple 10 (22) 21 (46) Previous adjuvant chemotherapy: FA/5-FU bolus Capecitabine Folfox4 9 (19) 4 (9) 1 (2) 4 (9) Previous radiotherapy: RT alone RT+CT (5-FU i.c.) RT+CT (XELOX) 6 (13) 2 (4) 3 (6) 1 (2)
 WHO Performance Status (96) 2 (4) Primary tumor colon rectum 22 (48) 24 (52) No. of involved sites (57) 20 (43) Sites of metastases liver lung lynph nodes local Other 31 (67) 11 (24) 17 (37) 9 (19) 5 (11) Liver metastases single Multiple 10 (22) 21 (46) Previous adjuvant chemotherapy: FA/5-FU bolus Capecitabine Folfox4 9 (19) 4 (9) 1 (2) 4 (9) Previous radiotherapy: RT alone RT+CT (5-FU i.c.) RT+CT (XELOX) 6 (13) 2 (4) 3 (6) 1 (2).")
28
Dose levels CPT11 (mg/m 2 d1,15)- Bevacizumab (mg/kg d1,15)- l-OHP (mg/m 2 d8,22)- 5-FU (mg/m 2 /d d1-2, 8-9, 15-16, 22-23) No. patients a (new patients) No. cycles No. Patients with DLT b /total patients (%) No. New patients with DLT/new patients (%) No. cycles with DLT/total cycles (%) DLTs I900-160-5-60 9 (9) 12 1/9 (11%) 1/9 (11%) 1/12 (8%) G3 Diarrhea II900-160-5-70 11 (3) 110/110/30/11- III900-160-5-80 14 (3) 41 1/14 (7%) 0/3 1/41 (2%) G3 Mucositis G2 Diarrhea + G2 Hypoalbumin. a intra- and inter-patient dose escalation ( Simon R. et al., JNCI 1997) b dose-limiting toxicity
 No. cycles No. Patients with DLT b /total patients (%) No. New patients with DLT/new patients (%) No. cycles with DLT/total cycles (%) DLTs I (9) 12 1/9 (11%) 1/9 (11%) 1/12 (8%) G3 Diarrhea II (3) 110/110/30/11- III (3) 41 1/14 (7%) 0/3 1/41 (2%) G3 Mucositis G2 Diarrhea + G2 Hypoalbumin. a intra- and inter-patient dose escalation ( Simon R. et al., JNCI 1997) b dose-limiting toxicity.")
29
PatientsCycles Number46196 NCI-CTC Grade12341234 Nausea (%)22 (48)12 (26)3 (7)-66 (34)19 (10)4 (2)- Vomiting (%)9 (20)6 (13)2 (4)-18 (9)9 (5)2 (1)- Diarrhea (%)19 (41)13 (28)11 (24)-58 (30)26 (13)12 (6)- Hypoalbuminemia (%)2 (4)1 (2)--2 (1)1 (0.5)-- Constipation (%)15 (33)1 (2)--20 (10)1 (0.5)-- Stomatitis/mucositis (%)14 (30)2 (4)3 (6.5)-24 (12)3 (1.5) - Erythema (%)1 (2)- -3 (1.5)-1 (0.5)- Asthenia (%)11 (24)19 (41)2 (4)-32 (16)30 (15)2 (1)- Neurotoxicity (%)31 (67)5 (11)--101 (52)6 (3)-- Hypertension (%)12 (26)4 (9)1 (2)-22 (11)4 (2)1 (0.5)- Hypotension (%)1 (2)---1 (0.5)--- Hematuria (%)2 (4)1 (2)--3 (1.5)1 (0.5)-- Gengival recession/gengivitis (%)7 (15)---10 (5)--- Rhinitis (%)32 (70)---86 (44)--- Epistaxis (%)25 (54)2 (4)--59 (30)--- HFS (%)1 (2)---1 (0.5)--- Headache (%)5 (11)---8 (4)--- Hypokalemia (%)3 (6.5)1 (2)--2 (1)-1 (0.5)- Hypertransaminasemy (%)3 (6.5)1 (2) 7 (15)3 (1.5)1 (0.5) Hyperpigmentation (%)6 (13)2 (4)--11 (6)2 (1)-- Fever without infection (%)10 (22)---11 (6)--- Alopecia (%)3 (6.5)8 (17)2 (4)-7 (4)12 (6)5 (3)-
22 (48)12 (26)3 (7)-66 (34)19 (10)4 (2)- Vomiting (%)9 (20)6 (13)2 (4)-18 (9)9 (5)2 (1)- Diarrhea (%)19 (41)13 (28)11 (24)-58 (30)26 (13)12 (6)- Hypoalbuminemia (%)2 (4)1 (2)--2 (1)1 (0.5)-- Constipation (%)15 (33)1 (2)--20 (10)1 (0.5)-- Stomatitis/mucositis (%)14 (30)2 (4)3 (6.5)-24 (12)3 (1.5) - Erythema (%)1 (2)- -3 (1.5)-1 (0.5)- Asthenia (%)11 (24)19 (41)2 (4)-32 (16)30 (15)2 (1)- Neurotoxicity (%)31 (67)5 (11)--101 (52)6 (3)-- Hypertension (%)12 (26)4 (9)1 (2)-22 (11)4 (2)1 (0.5)- Hypotension (%)1 (2)---1 (0.5)--- Hematuria (%)2 (4)1 (2)--3 (1.5)1 (0.5)-- Gengival recession/gengivitis (%)7 (15)---10 (5)--- Rhinitis (%)32 (70)---86 (44)--- Epistaxis (%)25 (54)2 (4)--59 (30)--- HFS (%)1 (2)---1 (0.5)--- Headache (%)5 (11)---8 (4)--- Hypokalemia (%)3 (6.5)1 (2)--2 (1)-1 (0.5)- Hypertransaminasemy (%)3 (6.5)1 (2) 7 (15)3 (1.5)1 (0.5) Hyperpigmentation (%)6 (13)2 (4)--11 (6)2 (1)-- Fever without infection (%)10 (22)---11 (6)--- Alopecia (%)3 (6.5)8 (17)2 (4)-7 (4)12 (6)5 (3)-")
30
PatientsCycles Number46196 NCI-CTC Grade12341234 Anemia (%)7 (15)1 (2)--13 (7)1 (0.5)-- Leucopenia (%)12 (26)11 (24)--37 (19)16 (8)-- Neutropenia (%)8 (17)11 (24)4 (9)-28 (14)18 (9)7 (4)- Trhombocitopeny (%)5 (11)1 (2)--14 (7)1 (0.5)--
7 (15)1 (2)--13 (7)1 (0.5)-- Leucopenia (%)12 (26)11 (24)--37 (19)16 (8)-- Neutropenia (%)8 (17)11 (24)4 (9)-28 (14)18 (9)7 (4)- Trhombocitopeny (%)5 (11)1 (2)--14 (7)1 (0.5)--")
31
Intention to treat analysis (%) As Treated analysis (%) n. assessable patients 3935 CR 2 (5) 2 (6) PR 30 (77) 27 (77) SD 2 (5) 2 (6) PD 5 (13) 4 (11) CR complete response; PR partial response; SD stable disease; PD progressive disease 1 pt lost to follow-up; 6 pts had not received at least 3 cycles of treatment; 4 pts evaluated after 2 cycles of treatment
 2 (6) PR 30 (77) 27 (77) SD 2 (5) 2 (6) PD 5 (13) 4 (11) CR complete response; PR partial response; SD stable disease; PD progressive disease 1 pt lost to follow-up; 6 pts had not received at least 3 cycles of treatment; 4 pts evaluated after 2 cycles of treatment.")
32
Intention to treat analysis (%) As Treated analysis (%) n. assessable patients 3935 CR 2 (5) 2 (6) PR 30 (77) 27 (77) SD 2 (5) 2 (6) PD 5 (13) 4 (11) ITT Overall Response Rate (ORR) 82% (α0.05; CI 12) ITT Disease Control Rate 87% AsT Overall Response Rate (ORR) 83% (α0.05; CI 13) AsT Disease Control Rate 89%
 2 (6) PR 30 (77) 27 (77) SD 2 (5) 2 (6) PD 5 (13) 4 (11) ITT Overall Response Rate (ORR) 82% (α0.05; CI 12) ITT Disease Control Rate 87% AsT Overall Response Rate (ORR) 83% (α0.05; CI 13) AsT Disease Control Rate 89%.")
33
BEV5-FUCPT-11L-OHP Mediana (range) Media (C.I. α 0,05) Mediana (range) Media (C.I. α 0,05) Mediana (range) Media (C.I. α 0,05) Mediana (range) Media (C.I. α 0,05) DI/ciclo mg/m 2 (Kg)/w 2,25 (1-2,5) 2,1 ( 0,06) 1575 (720-1800) 1519 ( 47,1) 72 (25-80) 68 ( 2,1) 35 (14-40) 33 (1,05) DI/pz mg/m 2 (Kg)/w 2,1 (1,7-2,5) 2 ( 0,08) 1530 (955-1800) 1514 ( 66) 67 (50-80) 68 ( 2,9) 33 (21-38) 32 (1,45) 33 BEV84% of projected D.I. 5-FU85% of projected D.I. CPT-1184% of projected D.I. OXP82% of projected D.I.
 Mediana (range) Media (C.I. α 0,05) Mediana (range) Media (C.I. α 0,05) DI/ciclo mg/m 2 (Kg)/w 2,25 (1-2,5) 2,1 ( 0,06) 1575 ( ) 1519 ( 47,1) 72 (25-80) 68 ( 2,1) 35 (14-40) 33 (1,05) DI/pz mg/m 2 (Kg)/w 2,1 (1,7-2,5) 2 ( 0,08) 1530 ( ) 1514 ( 66) 67 (50-80) 68 ( 2,9) 33 (21-38) 32 (1,45) 33 BEV84% of projected D.I. 5-FU85% of projected D.I. CPT-1184% of projected D.I. OXP82% of projected D.I..")
34
34 With a median follow-up of 12 months (range 1-31), we observed: Median Progression Free Survival (PFS)* 12 months (Range months 1+ - 30+) Median Overall Survival (OS)* 28 months (Range months 1+ - 31+) *calculated with method of Kaplan and Meier
, we observed: Median Progression Free Survival (PFS)* 12 months (Range months ) Median Overall Survival (OS)* 28 months (Range months ) *calculated with method of Kaplan and Meier")
35
35 Total N. (%) No. of patients6/46 (13) Sites liver single multiple liver and lung primary tumor and lymph nodes 3/6 (50) 2/3(67) 1/3 (33) 1/6 (17) 2/6 (33)
 Sites liver single multiple liver and lung primary tumor and lymph nodes 3/6 (50) 2/3(67) 1/3 (33) 1/6 (17) 2/6 (33).")
37
DTX 80-85 mg/mq 5-FU 700-900 mg/mq/d 22 10 22 10 22 10 22 10 22 10 1234512345 day h 10pm-10amTFI traces the 12h circadian-timed infusion of 5-FU (10PM-10AM with maximum delivery at 4AM) and may contribute to increase its tolerability, using an easier administration than the chromodulated infusion.
 and may contribute to increase its tolerability, using an easier administration than the chromodulated infusion.")
41
As Treated analysis (%) n. assessable patients 13/14 CR 2 (15) PR 6 (46) SD 3 (24) PD 2 (15) AsT Overall Response Rate (ORR) 61% (α0.05; CI 28) AsT Disease Control Rate 82%
 PR 6 (46) SD 3 (24) PD 2 (15) AsT Overall Response Rate (ORR) 61% (α0.05; CI 28) AsT Disease Control Rate 82%.")
42
Recommended DoseMTD a Authorpts5-FU schedule docetaxel mg/m 2 5-FU mg/m 2 /d docetaxel mg/m 2 5-FU mg/m 2 /d DLT b Petit [22]37bolus60 d1 every 4 w 300 d1-3 or d1-5 every 4 w 75 d1300 d1-3mucositis neutropenia Ando [23]19C.I.50 d1 every 3 w 500 d1-5 every 3 w 60 d1500 d1-5diarrhea neutropenia Lortholary [24]32C.I.85 d1 every 3 w 750 d1-5 every 3 w 100 d1750 d1-5stomatitis Present study1412-h C.I.85 d1 every 3 w 800 d1-5 every 3 w 85 d1900 d1-5diarrhea a MTD maximum-tolerated dose b DLT dose-limiting toxicity
![Recommended DoseMTD a Authorpts5-FU schedule docetaxel mg/m 2 5-FU mg/m 2 /d docetaxel mg/m 2 5-FU mg/m 2 /d DLT b Petit [22]37bolus60 d1 every 4 w 300 d1-3 or d1-5 every 4 w 75 d1300 d1-3mucositis neutropenia Ando [23]19C.I.50 d1 every 3 w 500 d1-5 every 3 w 60 d1500 d1-5diarrhea neutropenia Lortholary [24]32C.I.85 d1 every 3 w 750 d1-5 every 3 w 100 d1750 d1-5stomatitis Present study1412-h C.I.85 d1 every 3 w 800 d1-5 every 3 w 85 d1900 d1-5diarrhea a MTD maximum-tolerated dose b DLT dose-limiting toxicity](http://images.slideplayer.com/1/549733/slides/slide_42.jpg "Recommended DoseMTD a Authorpts5-FU schedule docetaxel mg/m 2 5-FU mg/m 2 /d docetaxel mg/m 2 5-FU mg/m 2 /d DLT b Petit [22]37bolus60 d1 every 4 w 300 d1-3 or d1-5 every 4 w 75 d1300 d1-3mucositis neutropenia Ando [23]19C.I.50 d1 every 3 w 500 d1-5 every 3 w 60 d1500 d1-5diarrhea neutropenia Lortholary [24]32C.I.85 d1 every 3 w 750 d1-5 every 3 w 100 d1750 d1-5stomatitis Present study1412-h C.I.85 d1 every 3 w 800 d1-5 every 3 w 85 d1900 d1-5diarrhea a MTD maximum-tolerated dose b DLT dose-limiting toxicity")
44
n (%) Number of patients Median age Range 18(100) 59 48-74 WHO performance status: 0 1 15(83) 3(16) Surgery: Mastectomy Lumpectomy 6(33) 12(68) Adjuvant therapy: Chemotherapy with anthracyclines Chemotherapy without anthracyclines Hormonal therapy Radiotherapy 9(53) 5(30) 7(40) Previous metastatic breast cancer therapy: Hormonal therapy2(13) Disease sites: Soft tissue and skin Liver Lung and pleura Bone Brain 1(6) 9(50) 1 2(70) 2(11) Number of organs involved: 1 2 2(12) 15(83)
 Number of patients Median age Range 18(100) WHO performance status: (83) 3(16) Surgery: Mastectomy Lumpectomy 6(33) 12(68) Adjuvant therapy: Chemotherapy with anthracyclines Chemotherapy without anthracyclines Hormonal therapy Radiotherapy 9(53) 5(30) 7(40) Previous metastatic breast cancer therapy: Hormonal therapy2(13) Disease sites: Soft tissue and skin Liver Lung and pleura Bone Brain 1(6) 9(50) 1 2(70) 2(11) Number of organs involved: 1 2 2(12) 15(83)")
45
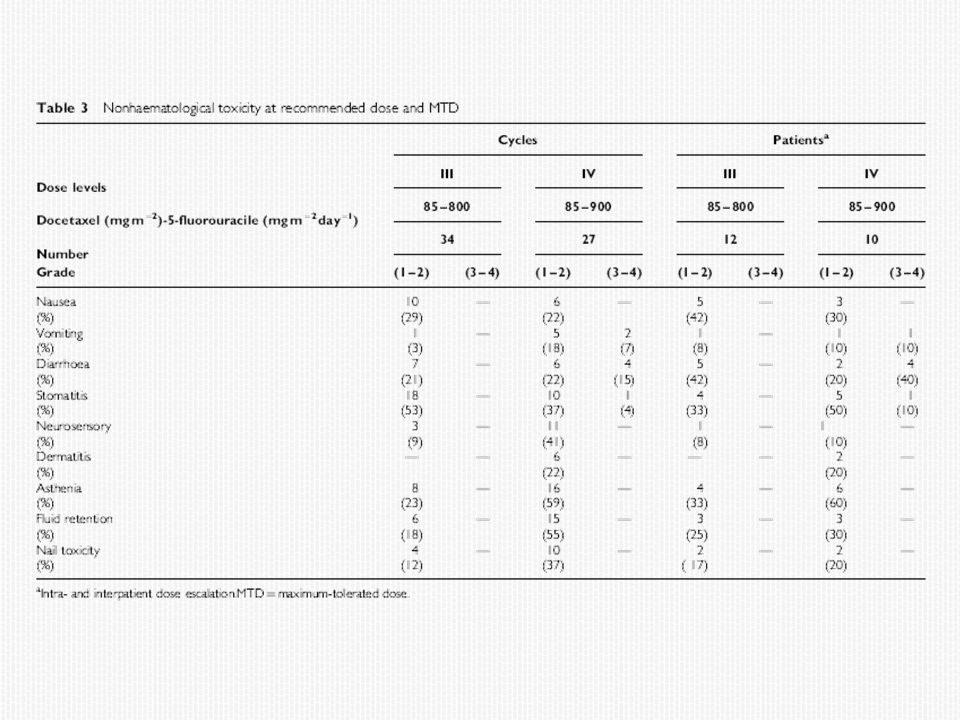
Cycles 141 Patients 18 Grade12341234 Fever (%)-4 (3)---3 (23)-- Neutropenia (%)1 (1)12 (8)24 (17)29 (20)-1 (5)2 (11)13 (76) Leucopenia (%)4 (3)20 (16)28 (19)8 (5)1 (5) 9 (52)5 (29) Anemia (%)8 (6)1 (1)--4 (23)1 (5)-- Nausea (%)11 (9)5 (4)--4 (23) -- Vomiting (%)3 (2)2 (1)--2 (11) -- Diarrhea (%)4 (3)2 (1)--4 (23)2 (11)-- Stomatitis (%)7 (5) 3 (2)1 (1)2 (11)4 (23)3 (17)1 (1) Neurotoxicity (%)2 (1)---2 (11)--- Dermatitis (%)-2 (1)---2 (11)-- Fluid retention (%)5 (4)----3 (17)-- Asthenia (%)1 (1)----1 (5)-- Cardiotoxicity (%)-------- 2 cases (8%) of thrombosis related to the venous access dev
-4 (3)---3 (23)-- Neutropenia (%)1 (1)12 (8)24 (17)29 (20)-1 (5)2 (11)13 (76) Leucopenia (%)4 (3)20 (16)28 (19)8 (5)1 (5) 9 (52)5 (29) Anemia (%)8 (6)1 (1)--4 (23)1 (5)-- Nausea (%)11 (9)5 (4)--4 (23) -- Vomiting (%)3 (2)2 (1)--2 (11) -- Diarrhea (%)4 (3)2 (1)--4 (23)2 (11)-- Stomatitis (%)7 (5) 3 (2)1 (1)2 (11)4 (23)3 (17)1 (1) Neurotoxicity (%)2 (1)---2 (11)--- Dermatitis (%)-2 (1)---2 (11)-- Fluid retention (%)5 (4)----3 (17)-- Asthenia (%)1 (1)----1 (5)-- Cardiotoxicity (%) cases (8%) of thrombosis related to the venous access dev")
46
As Treated analysis (%) n. assessable patients 13/14 CR 2 (15) PR 6 (46) SD 3 (24) PD 2 (15) AsT Overall Response Rate (ORR) 61% (α0.05; CI 28) AsT Disease Control Rate 82%
 PR 6 (46) SD 3 (24) PD 2 (15) AsT Overall Response Rate (ORR) 61% (α0.05; CI 28) AsT Disease Control Rate 82%.")
47
47 We observed: Median Progression Free Survival (PFS)* 10 months (Range months 4 - 28) Median Overall Survival (OS)* 25 months (Range months 4 - 46+) *calculated with method of Kaplan and Meier
* 10 months (Range months ) Median Overall Survival (OS)* 25 months (Range months ) *calculated with method of Kaplan and Meier")
48
Grazie per lattenzione

Similar presentations