Download presentation
Presentation is loading. Please wait.

1
Log-linear analysis Summary

2
Focus on data analysis Focus on underlying process Focus on model specification Focus on likelihood approach Focus on ‘complete-data likelihood’ Focus on prediction Focus on interaction/association Link with risk analysis Unified perspective on different models The approach

3
Risk measures Count: Number of events during given period ( observation window ) Probability: probability of an outcome: proportion of risk set experiencing a given outcome (event) at least once Risk set = all persons at risk at given point in time. Rate: number of events per time unit of exposure (per unit of any measure of size, e.g. time, space, miles travelled)
.")
4
Risk measures Difference of probabilities: p 1 - p 2 Relative risk: ratio of probabilities (focus: risk factor) prob. of event in presence of risk factor/ prob. of event in absence of risk factor (control group; reference category): p 1 / p 2 Odds: odds on an outcome: ratio of favourable outcomes to unfavourable outcomes. Chance of one outcome rather than another: p 1 / (1-p 1 ) The odds are what matter when placing a bet on a given outcome, i.e. when something is at stake. Odds reflect the degree of belief in a given outcome. Relation odds and relative risk: Agresti, 1996, p. 25
: p 1 / p 2 Odds: odds on an outcome: ratio of favourable outcomes to unfavourable outcomes. Chance of one outcome rather than another: p 1 / (1-p 1 ) The odds are what matter when placing a bet on a given outcome, i.e. when something is at stake. Odds reflect the degree of belief in a given outcome. Relation odds and relative risk: Agresti, 1996, p. 25.")
5
Risk measures Odds Odds ratio : ratio of odds (focus: risk indicator, covariate) odds in target group / odds in control group [reference category]: ratio of favourable outcomes in target group over ratio in control group. The odds ratio measures the ‘belief’ in a given outcome in two different populations or under two different conditions. If the odds ratio is one, the two populations or conditions are similar.
![Risk measures Odds Odds ratio : ratio of odds (focus: risk indicator, covariate) odds in target group / odds in control group [reference category]: ratio of favourable outcomes in target group over ratio in control group.](http://images.slideplayer.com/17/5376869/slides/slide_5.jpg "The odds ratio measures the ‘belief’ in a given outcome in two different populations or under two different conditions. If the odds ratio is one, the two populations or conditions are similar..")
6
Risk analysis Probability models: – Counts Poisson r.v. Poisson distribution Poisson regression / log-linear model – Probabilities binomial and multinomial r.v. binomial and multinomial distribution logistic regression / logit model (parameter p, probability of occurrence, is also called risk; e.g. Clayton and Hills, 1993, p. 7 ) – Rates Occurrences/exposure Poisson r.v. log-rate model
 – Rates Occurrences/exposure Poisson r.v. log-rate model.")
7
Analysis of count data Introduction to log-linear models

8
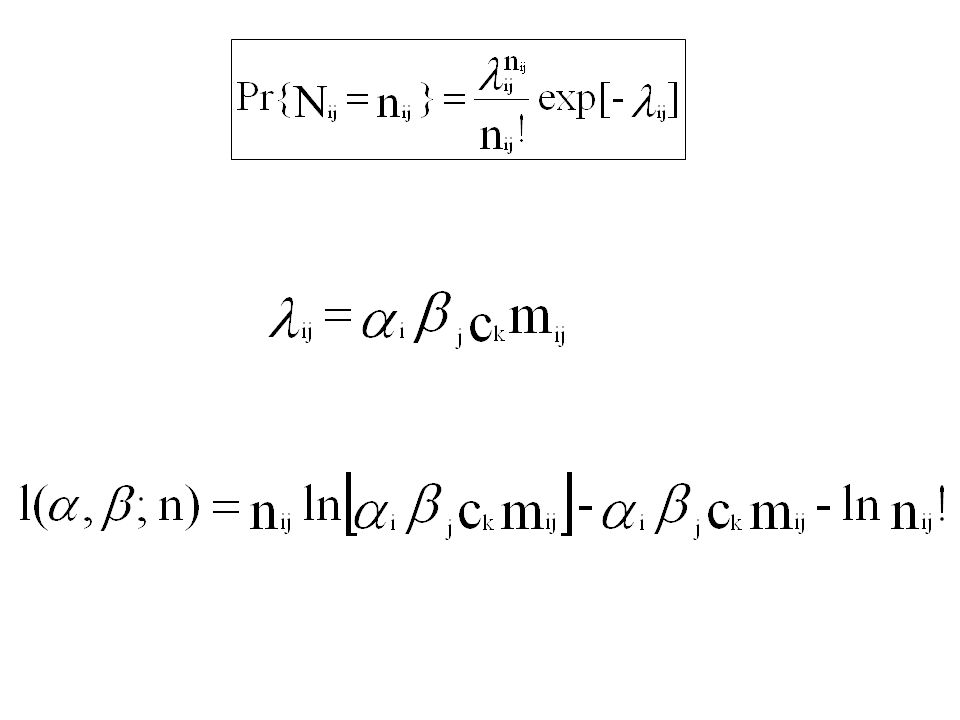
The Poisson probability model Let N be a random variable representing the number of events during a unit interval and let n be a realisation of n (COUNT): N is a Poisson r.v. following a Poisson distribution with parameter : The parameter is the expected number of events per unit time interval: = E[N]

9
Likelihood function Probability mass function : Log-likelihood function : Likelihood equations to determine ‘best’ value of

10
The log-linear model The objective of log-linear analysis is to determine if the distribution of counts among the cells of a table can be explained by a simpler, underlying structure. Log-linear models specify different structures in terms of the cross-classified variables (rows, columns and layers of the table).
..")
11
Log-linear models for two-way tables Saturated log-linear model: Overall effect (level) Main effects (marginal freq.) Interaction effect In case of 2 x 2 table: 4 observations 9 parameters Normalisation constraints
 Main effects (marginal freq.) Interaction effect In case of 2 x 2 table: 4 observations 9 parameters Normalisation constraints")
12
Relation log-linear model and Poisson regression model are dummy variables (0 if i or j is equal to 1and1 if i or j equal to 2) and interaction variable is
 and interaction variable is")
13
Design matrix unsaturated log-linear model Number of parameters exceeds number of equations need for additional equations (X’X) -1 is singular identify linear dependencies
 -1 is singular identify linear dependencies ")
14
Hybrid log-linear models Hybrid log-linear models contain unconventional effect parameters. Interaction effects are restricted in certain way. restrictions on interaction parameters.

15
Diagonals parameter model 1: (main) diagonal effect With c k = 1 for i j and c k = c for i = j (diagonal) Off-diagonal elements are independent and diagonal elements are changed by a common factor. Examples of hybrid log-linear models

16
Diagonals parameter model 3: the diagonal and each minor diagonal has unique effect parameter With k indicated the diagonal: k = R + i - j where R is the number of rows (or columns). There are 2R-1 values of c k. Application: APC models Diagonals parameter model 2: each diagonal element has separate effect parameter c k = 1 for i j and c k = c i for i = j (diagonal) Diagonal elements are predicted perfectly by the model
 Diagonal elements are predicted perfectly by the model.")
17
The log-rate model Statistical analysis of occurrence-exposure rates

18
The log-rate model: the occurrence matrix and the exposure matrix Occurrences: Number leaving home by age and sex, 1961 birth cohort: n ij Exposures: number of months living at home (includes censored observations): PM ij
: PM ij")
19
The log-rate model offset The log-rate model is a log-linear model with OFFSET (constant term) ij = E[N ij ] PM ij fixed
![The log-rate model offset The log-rate model is a log-linear model with OFFSET (constant term) ij = E[N ij ] PM ij fixed](http://images.slideplayer.com/17/5376869/slides/slide_19.jpg "The log-rate model offset The log-rate model is a log-linear model with OFFSET (constant term) ij = E[N ij ] PM ij fixed")
20
Log-rate model: rate = events/exposure Gravity model With c k = 1 for i j and c k = c for i = j (diagonal)
")
22
Logit model and log-linear model A comparison

23
Log-linear model: Select one variable as a dependent variable: response variable, e.g. does voting behaviour differ by sex Are females more likely to vote conservative than males? Logit model:

24
Males voting conservative rather than labour: Females voting conservative rather than labour: Are females more likely to vote conservative than males? Log-odds = logit Effect coding (1) A = Party; B = Sex
 A = Party; B = Sex.")
25
Are women more conservative than men? Do women vote more conservative than men? The odds ratio. If the odds ratio is positive, then the odds of voting conservative rather than labour is larger for women than men. In that case, women vote more conservative than men. Logit model: with a = and b = Log odds of reference category (males) Log odds ratio (odds females / odds males) with x = 0, 1
 Log odds ratio (odds females / odds males) with x = 0, 1.")
Similar presentations


. We now transition and begin discussion of.>")


