Download presentation
Presentation is loading. Please wait.

1
Understanding Drought
Gloria Forthun Regional Climatologist Southeast Regional Climate Center

2
Drought Characteristics

3
Drought Characteristics
Normal part of climate variability

4
Drought Characteristics
Normal part of climate variability No universal definition

5
Drought Characteristics
Normal part of climate variability No universal definition Complex – interdisciplinary

6
Drought Characteristics
Normal part of climate variability No universal definition Complex – interdisciplinary Impacts can be economic, social, environmental

7
Drought Characteristics
Normal part of climate variability No universal definition Complex – interdisciplinary Impacts can be economic, social, environmental Impacts can linger for years

8
Drought Vs. Other Natural Disasters

9
Drought Vs. Other Natural Disasters
Onset and end of drought is difficult to determine

10
Drought Vs. Other Natural Disasters
Onset and end of drought is difficult to determine No precise and universally accepted definition of drought

11
Drought Vs. Other Natural Disasters
Onset and end of drought is difficult to determine No precise and universally accepted definition of drought Nonstructural impacts and spread over a large geographic area

12
Types of Drought

13
Types of Drought Common to all droughts is that they originate from a deficiency of precipitation that results in water shortage for some activity or for some group. National Drought Mitigation Center

14
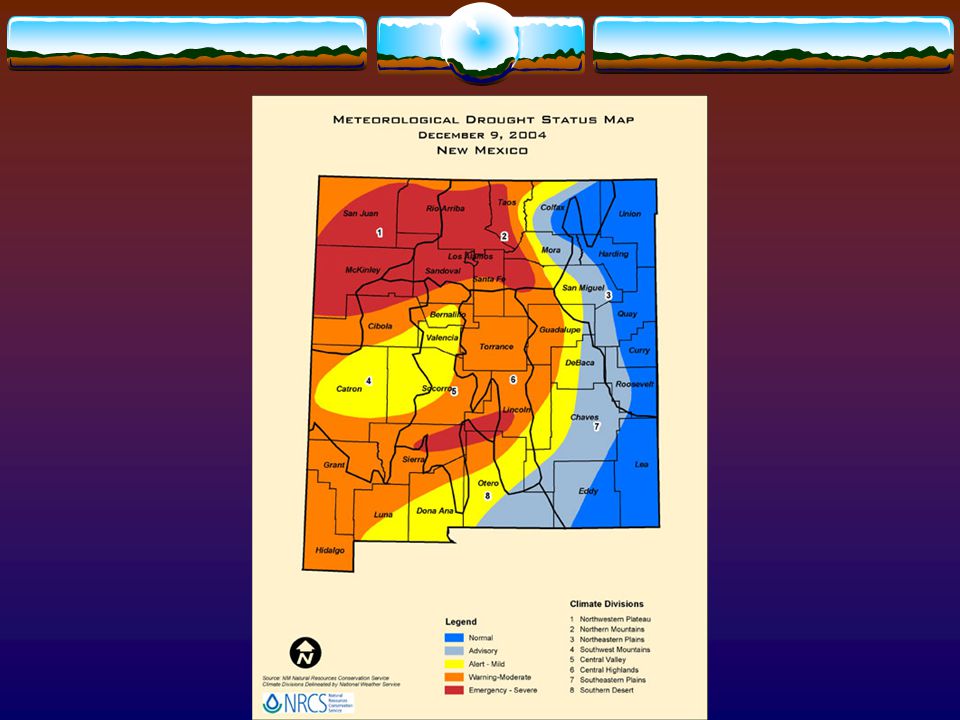
Types of Drought Meteorological Drought

15
Types of Drought Meteorological Drought
Measured in terms of the degree of dryness (intensity) and the duration of the dry period
 and the duration of the dry period.")
16
Types of Drought Meteorological Drought Region Specific
Measured in terms of the degree of dryness (intensity) and the duration of the dry period Region Specific
 and the duration of the dry period. Region Specific.")
18
Types of Drought Agricultural Drought

19
Types of Drought Agricultural Drought
Meteorological drought that impacts agriculture

20
Types of Drought Agricultural Drought
Meteorological drought that impacts agriculture Usually the first economic sector to be hit

21
Types of Drought Agricultural Drought
Meteorological drought that impacts agriculture Usually the first economic sector to be hit Precipitation shortages, ET, soil moisture, etc…

22
Types of Drought Agricultural Drought
Meteorological drought that impacts agriculture Usually the first economic sector to be hit Precipitation shortages, ET, soil moisture, etc… Plant water demand versus available soil moisture

23
Types of Drought

24
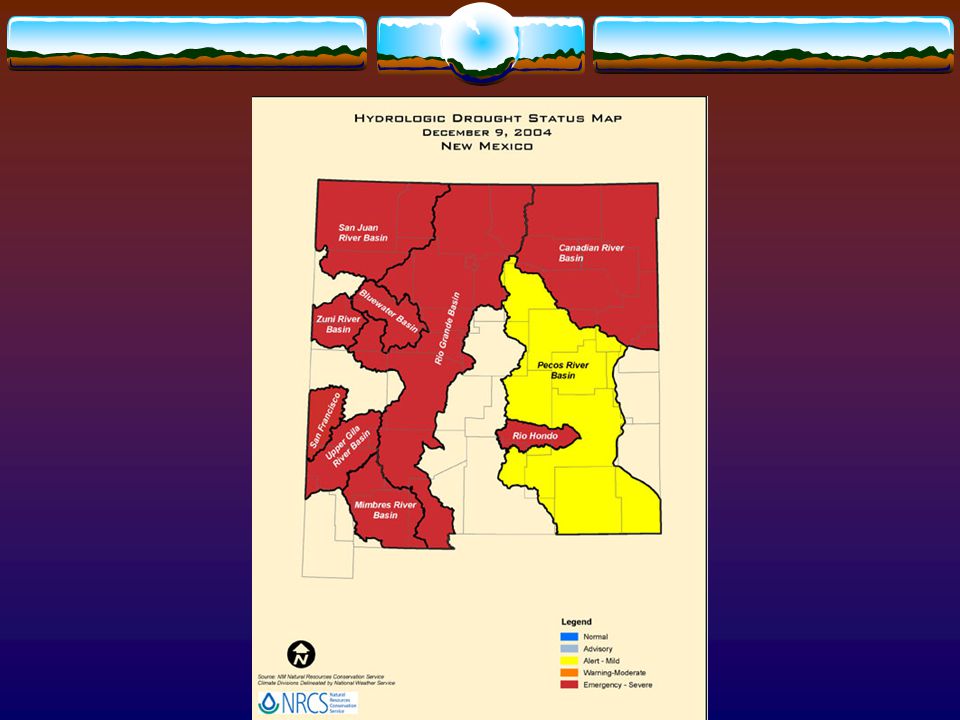
Types of Drought Hydrologic Drought

25
Types of Drought Hydrologic Drought
Impacts of rainfall shortages on the hydrologic system (groundwater, rivers, lakes, reservoirs)
")
26
Types of Drought Hydrologic Drought
Impacts of rainfall shortages on the hydrologic system (groundwater, rivers, lakes, reservoirs) Communities vary in degree of vulnerability depending on their water source
 Communities vary in degree of vulnerability depending on their water source.")
27
Types of Drought Hydrologic Drought
Impacts of rainfall shortages on the hydrologic system (groundwater, rivers, lakes, reservoirs) Communities vary in degree of vulnerability depending on their water source Connections between basins, regions affect other regions
 Communities vary in degree of vulnerability depending on their water source. Connections between basins, regions affect other regions.")
28
Types of Drought Hydrologic Drought
Impacts of rainfall shortages on the hydrologic system (groundwater, rivers, lakes, reservoirs) Communities vary in degree of vulnerability depending on their water source Connections between basins, regions affect other regions Out of phase or lag meteorological drought
 Communities vary in degree of vulnerability depending on their water source. Connections between basins, regions affect other regions. Out of phase or lag meteorological drought.")
29
Source: National Water and Climate Center

31
Types of Drought Socio-economic drought

32
Types of Drought Socio-economic drought
Demand exceeds supply of some economic product as a result of weather-related low precipitation event(s)
")
33
Types of Drought Socio-economic drought
Demand exceeds supply of some economic product as a result of weather-related low precipitation event(s) Precipitation or water represents SUPPLY, which varies by sector, DEMAND can be for products or for the water itself
 Precipitation or water represents SUPPLY, which varies by sector, DEMAND can be for products or for the water itself.")
34
Types of Drought Socio-economic drought Occurs more frequently
Demand exceeds supply of some economic product as a result of weather-related low precipitation event(s) Precipitation or water represents SUPPLY, which varies by sector, DEMAND can be for products or for the water itself Occurs more frequently change in how often or long a drought occurs in the vulnerability within society or both
 Precipitation or water represents SUPPLY, which varies by sector, DEMAND can be for products or for the water itself. Occurs more frequently. change in how often or long a drought occurs. in the vulnerability within society. or both.")
35
Differences Between Droughts

36
Differences Between Droughts
Intensity Degree of precipitation deficit and/or severity of impacts

37
Differences Between Droughts
Intensity Degree of precipitation deficit and/or severity of impacts Departure of a climate index from normal; linked to duration to determine impacts

38
Differences Between Droughts
Duration

39
Differences Between Droughts
Duration Seasonal Single-year Multiple-years

40
Differences Between Droughts
Duration Seasonal Single-year Multiple-years Multiple timescales Example: Year One – below normal Year Two -- near normal; timing off for crop demand Year Three – near normal; not enough to recover from hydrologic drought.

41
Differences Between Droughts
Spatial Extent Regions can be crop specific areas, climate divisions, water basins, coastal areas

42
Differences Between Droughts
Spatial Extent Regional in nature Result of large scale anomalies in atmospheric circulation patterns Regions can be crop specific areas, climate divisions, water basins, coastal areas

43
Differences Between Droughts
Spatial Extent Regional in nature Result of large scale anomalies in atmospheric circulation patterns One or more regions, one or more states Regions can be crop specific areas, climate divisions, water basins, coastal areas

44
Differences Between Droughts
Spatial Extent Regional in nature Result of large scale anomalies in atmospheric circulation patterns One or more regions, one or more states Can shift from season to season Regions can be crop specific areas, climate divisions, water basins, coastal areas

45
Risk and Vulnerability

46
Risk and Vulnerability
Hazard: Probability of occurrence, within a specified area and time, of a potentially damaging natural event (drought) Wilhite, 1997
 Wilhite,")
47
Risk and Vulnerability
Hazard Vulnerability: Characteristics of people, activities, or the environment that makes them susceptible to the impacts of drought; measure of the ability to anticipate, cope with, resist, and recover from the impacts of drought Wilhite, 1997

48
Risk and Vulnerability
Hazard Vulnerability Risk: Result of exposure to hazard and vulnerability

49
Drought RISK Natural Hazard Vulnerability
Reduction in rainfall over an extended period of time Social Component Demand exceeds Supply Intensity Duration Spatial Extent Natural Hazard Vulnerability RISK

50
Monitoring Drought Why should we monitor drought?

51
Monitoring Drought Why should we monitor drought?
Determine the current status of specific resources

52
Monitoring Drought Why should we monitor drought?
Determine the current status of specific resources Detect changes and long-term trends

53
Monitoring Drought Why should we monitor drought?
Determine the current status of specific resources Detect changes and long-term trends Obtain knowledge of fundamental linkages and processes at work

54
Monitoring Drought Why should we monitor drought?
Determine the current status of specific resources Detect changes and long-term trends Obtain knowledge of fundamental linkages and processes at work Enable development and implementation of early warning indicators

55
Monitoring Drought What is needed to monitor drought?

56
Monitoring Drought What is needed to monitor drought?
Combination of climate, soil, and water data

57
Monitoring Drought What is needed to monitor drought?
Combination of climate, soil, and water data Local and regional coverage

58
Monitoring Drought What is needed to monitor drought?
Combination of climate, soil, and water data Local and regional coverage Impact assessments

59
Monitoring Drought What is needed to monitor drought? Drought Indices
Combination of climate, soil, and water data Local and regional coverage Impact assessments Drought Indices

60
Monitoring Drought Importance of Drought Indices

61
Monitoring Drought Importance of Drought Indices
Simplify complex interrelationships and provide a good communication tool for many audiences

62
Monitoring Drought Importance of Drought Indices
Simplify complex interrelationships and provide a good communication tool for many audiences Quantitative assessment of climate conditions

63
Monitoring Drought Importance of Drought Indices
Simplify complex interrelationships and provide a good communication tool for many audiences Quantitative assessment of climate conditions Provide a historical perspective that can be used in planning and design applications

64
Drought Indices Percent of Normal Precipitation
Actual Precipitation divided by Normal Precipitation X 100%

65
Drought Indices Percent of Normal Precipitation
Simple measurement of rainfall Actual Precipitation divided by Normal Precipitation X 100%

66
Drought Indices Percent of Normal Precipitation
Simple measurement of rainfall Effective when used for a single region or single season Actual Precipitation divided by Normal Precipitation X 100%

67
Drought Indices Percent of Normal Precipitation
Simple measurement of rainfall Effective when used for a single region or single season Disadvantage: Mean (average) is not the same as the median (value exceeded by 50% of precipitation events) Actual Precipitation divided by Normal Precipitation X 100%
 is not the same as the median (value exceeded by 50% of precipitation events) Actual Precipitation divided by Normal Precipitation X 100%")
68
Drought Indices Percent of Normal Precipitation
Simple measurement of rainfall Effective when used for a single region or single season Disadvantage: Mean (average) is not the same as the median (value exceeded by 50% of precipitation events) Example: Mean precipitation = 1.26”, Median = .77”, half the years are above .77” and half are below .77”. Using the mean, .77” would be 61% of normal Actual Precipitation divided by Normal Precipitation X 100%
 is not the same as the median (value exceeded by 50% of precipitation events) Example: Mean precipitation = 1.26 , Median = .77 , half the years are above .77 and half are below Using the mean, .77 would be 61% of normal. Actual Precipitation divided by Normal Precipitation X 100%")
70
Drought Indices Standardized Precipitation Index

71
Drought Indices Standardized Precipitation Index
Based only on precipitation

72
Drought Indices Standardized Precipitation Index
Based only on precipitation Normalized distribution so values are standard deviations from the median

73
Drought Indices Standardized Precipitation Index
Based only on precipitation Normalized distribution so values are standard deviations from the median Developed for multiple time scales to show impacts on different water resources

74
Data from the Western Regional Climate Center
72 months = Nov. 1998 Data from the Western Regional Climate Center

75
Drought Indices Palmer Drought Severity Index Have PDSI back to 1895

76
Drought Indices Palmer Drought Severity Index Advantages
Based on precipitation, temperature, and local available water content of the soil

77
Drought Indices Palmer Drought Severity Index Advantages
Based on precipitation, temperature, and local available water content of the soil Most effective for impacts sensitive to soil moisture conditions

78
Drought Indices Palmer Drought Severity Index Advantages
Based on precipitation, temperature, and local available water content of the soil Most effective for impacts sensitive to soil moisture conditions Provides a measurement of the abnormality of recent weather

79
Drought Indices Palmer Drought Severity Index Advantages
Based on precipitation, temperature, and local available water content of the soil Most effective for impacts sensitive to soil moisture conditions Provides a measurement of the abnormality of recent weather Places current conditions in a historical perspective

80
Drought Indices Palmer Drought Severity Index Disadvantages
Not used in other countries

81
Drought Indices Palmer Drought Severity Index Disadvantages
Values for intensity, beginning of drought, and ending of drought are arbitrary and the same across US

82
Drought Indices Palmer Drought Severity Index Disadvantages
Values for intensity, beginning of drought, and ending of drought are arbitrary and the same across US Assumes no runoff until soil is saturated

83
Drought Indices Palmer Drought Severity Index Disadvantages
Values for intensity, beginning of drought, and ending of drought are arbitrary and the same across US Assumes no runoff until soil is saturated Assumes no frozen precipitation or frozen ground

84
Drought Indices Palmer Drought Severity Index Disadvantages
Values for intensity, beginning of drought, and ending of drought are arbitrary and the same across US Assumes no runoff until soil is saturated Assumes no frozen precipitation or frozen ground Percent of time an area is in severe or extreme drought is greater than probability can account for

85
Data from NOAA/CPC

86
Drought Indices Crop Moisture Index

87
Drought Indices Crop Moisture Index
Derived from Palmer Drought Severity Index

88
Drought Indices Crop Moisture Index Short term moisture conditions
Derived from Palmer Drought Severity Index Short term moisture conditions responds rapidly to changing conditions

89
Drought Indices Crop Moisture Index
Derived from Palmer Drought Severity Index Short term moisture conditions responds rapidly to changing conditions Useful for identifying potential agricultural drought

90
Drought Indices Crop Moisture Index
Derived from Palmer Drought Severity Index Short term moisture conditions responds rapidly to changing conditions Useful for identifying potential agricultural drought Misleading for long-term conditions

91
Data from NOAA/CPC

92
Drought Indices Z – Index

93
Drought Indices Z – Index Monthly Moisture Anomaly Index

94
Drought Indices Z – Index
Monthly Moisture Anomaly Index Moisture departure for the past 4 weeks and a climate weighting factor

95
Drought Indices Z – Index Indicator of potential forest fire ignition
Monthly Moisture Anomaly Index Moisture departure for the past 4 weeks and a climate weighting factor Indicator of potential forest fire ignition

96
Data from NOAA/CPC

97
Drought Indices Surface Water Supply Index

98
Drought Indices Surface Water Supply Index
Indicator of surface water conditions where mountain snowpack is a major component

99
Drought Indices Surface Water Supply Index Calculated by river basin
Indicator of surface water conditions where mountain snowpack is a major component Calculated by river basin

100
Drought Indices Surface Water Supply Index
Indicator of surface water conditions where mountain snowpack is a major component Calculated by river basin Based on snowpack, streamflow, precipitation, and reservoir storage

101
Drought Indices Surface Water Supply Index
Indicator of surface water conditions where mountain snowpack is a major component Calculated by river basin Based on snowpack, streamflow, precipitation, and reservoir storage Needs to be re-evaluated if there are changes in water management within the basin

102
NRCS/USDA

103
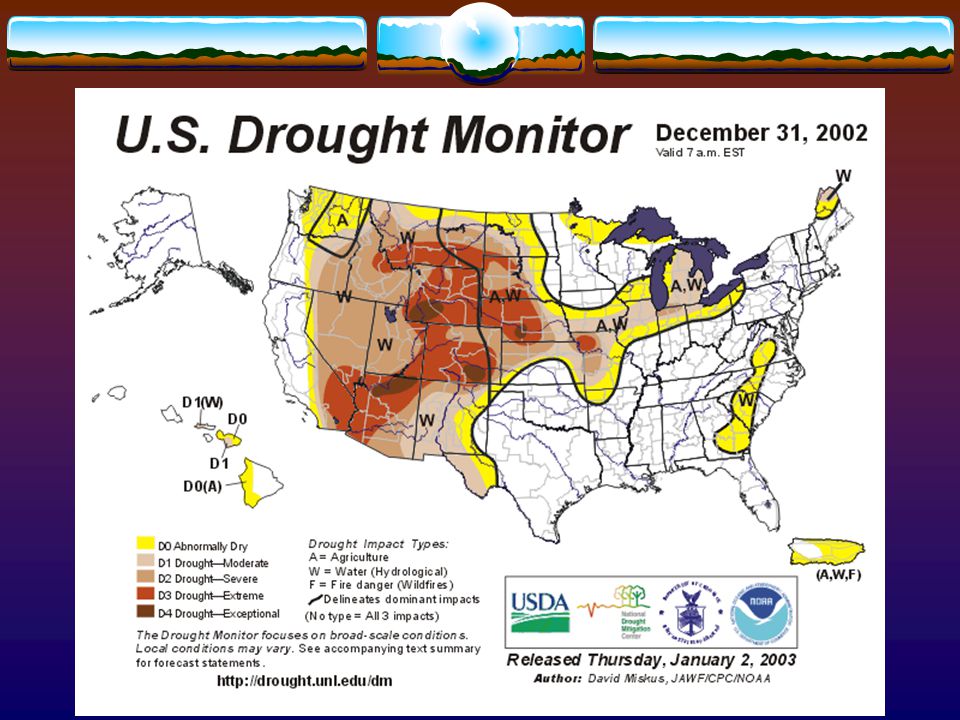
National Drought Monitor
Blends multiple indices and outlooks No single index can be relied upon under all conditions

104
National Drought Monitor
Blends multiple indices and outlooks Input from federal and academic scientists

105
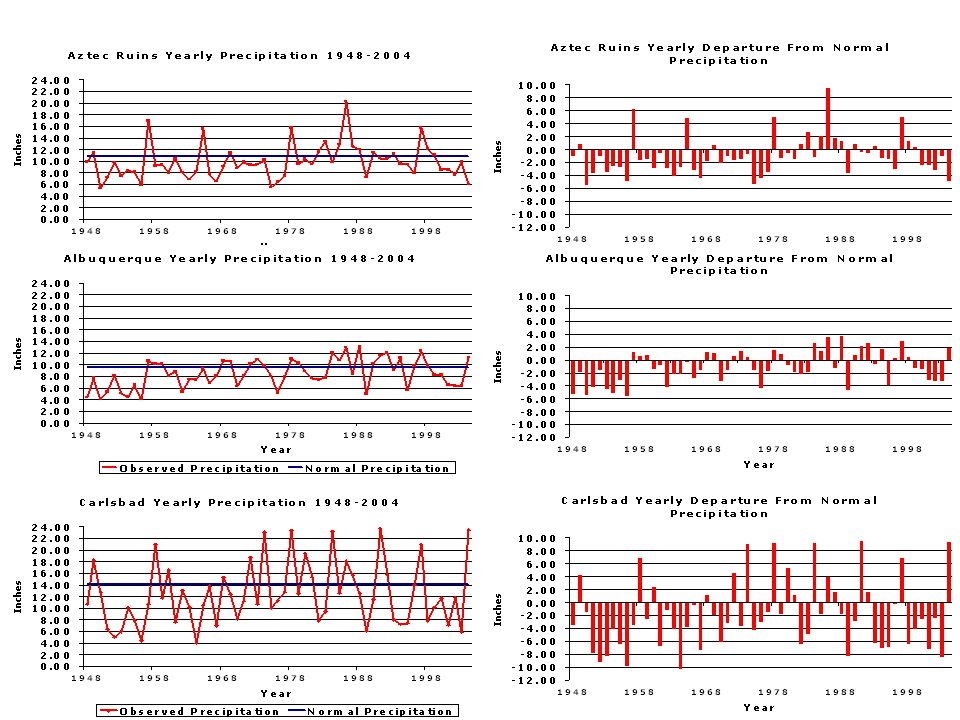
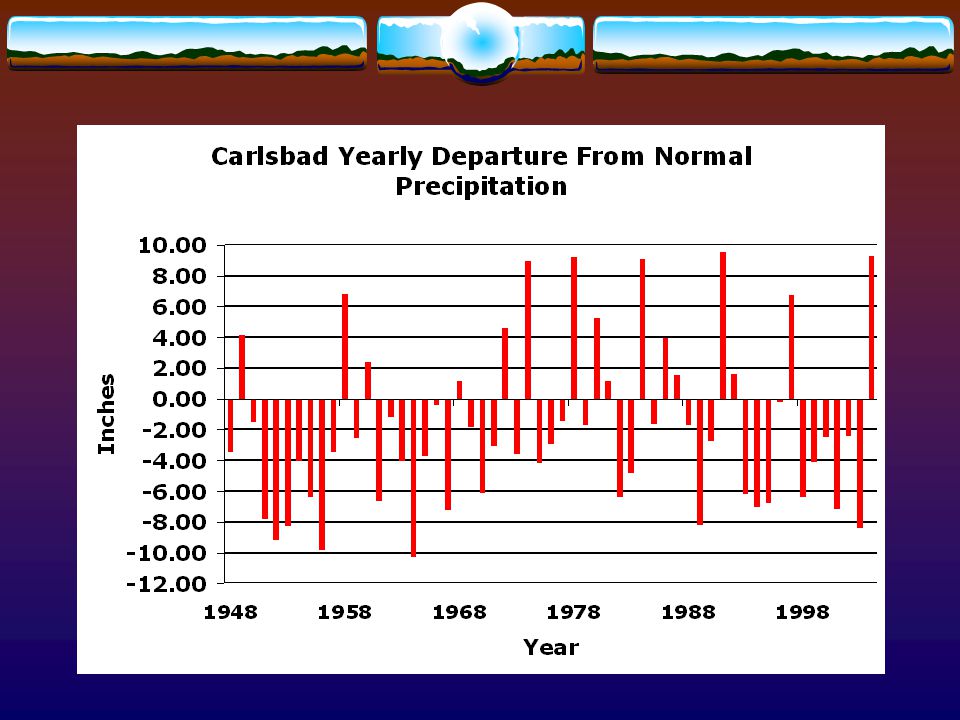
Drought In New Mexico Aztec Ruins National Park Northwest
Albuquerque Central Carlsbad Southeast

116
Understanding Drought Conclusions

117
Understanding Drought Conclusions
Normal part of climate variability

118
Understanding Drought Conclusions
Normal part of climate variability Onset and end of drought is difficult to determine

119
Understanding Drought Conclusions
Normal part of climate variability Onset and end of drought is difficult to determine Nonstructural impacts

120
Understanding Drought Conclusions
Differences Between Droughts

121
Understanding Drought Conclusions
Differences Between Droughts Intensity

122
Understanding Drought Conclusions
Differences Between Droughts Intensity Duration

123
Understanding Drought Conclusions
Differences Between Droughts Intensity Duration Spatial Extent

124
Understanding Drought Conclusions
Monitoring Drought Drought Indices

125
Understanding Drought Conclusions
Monitoring Drought Drought Indices Quantitative assessment of climate conditions

126
Understanding Drought Conclusions
Monitoring Drought Drought Indices Quantitative assessment of climate conditions Combination of drought indices to give overall picture of what is occurring

127
Understanding Drought Conclusions
Types of Drought

128
Understanding Drought Conclusions
Types of Drought Meteorological

129
Understanding Drought Conclusions
Types of Drought Meteorological Agricultural

130
Understanding Drought Conclusions
Types of Drought Meteorological Agricultural Hydrologic

131
Understanding Drought Conclusions
Types of Drought Meteorological Agricultural Hydrologic Socio-economic

132
Understanding Drought Conclusions
Types of Drought Meteorological Agricultural Hydrologic Socio-economic Hazard X Vulnerability = Risk

134
U.S. Census Bureau

135
Thank you. Any questions?

Similar presentations


 Water Resources (from IPCC WG-2, Chapter 3) Water Resources Primary Source: IPCC WG-2 Chapter 3 – Freshwater.>")


