Download presentation
Presentation is loading. Please wait.

1
Exploitation of Ensemble Output (and other operationally cool stuff) at NCEP HPC Peter C. Manousos NCEP HPC Science & Operations Officer (peter.manousos@noaa.gov)

2
Goals of Presentation Show how ensemble output is exploited at HPC Briefly –Sneak in an intro on NCEP and HPC –Provide a short term roadmap for the NCEP modeling system –Introduce downscaling techniques employed at HPC Answer questions

3
NWS CONSTRUCT OF OPERATIONAL OFFICES CWSUs and Regional Headquarters not depicted WFOs RFCs

4
HPC PRODUCTS AND SERVICES QPF –5 Day QPF –Excessive Rainfall –Probabilistic Snow/Ice –Compile National Flood Outlook Fronts/pressures –Surface Analysis & Daily Wx Map –12h - Day 7 Forecasts –General Weather through 48h –Day 3-7 Max/Min/24h PoP (gridded) –Tropical guidance (to Day 7) Model diagnostics International Desk Experimental products HPC also provides Emergency & Special Products and Services http://www.hpc.ncep.noaa.gov
 –Tropical guidance (to Day 7) Model diagnostics International Desk Experimental products HPC also provides Emergency & Special Products and Services")
5
Ensemble Exploitation

6
Static Reference Nominally derived ensemble parameters (means, spreads, clusters, etc.) Serve as reference to quantify pattern evolution uncertainty and assist in pattern evolution preference http://www.hpc.ncep.noaa.gov/mdd
 Serve as reference to quantify pattern evolution uncertainty and assist in pattern evolution preference")
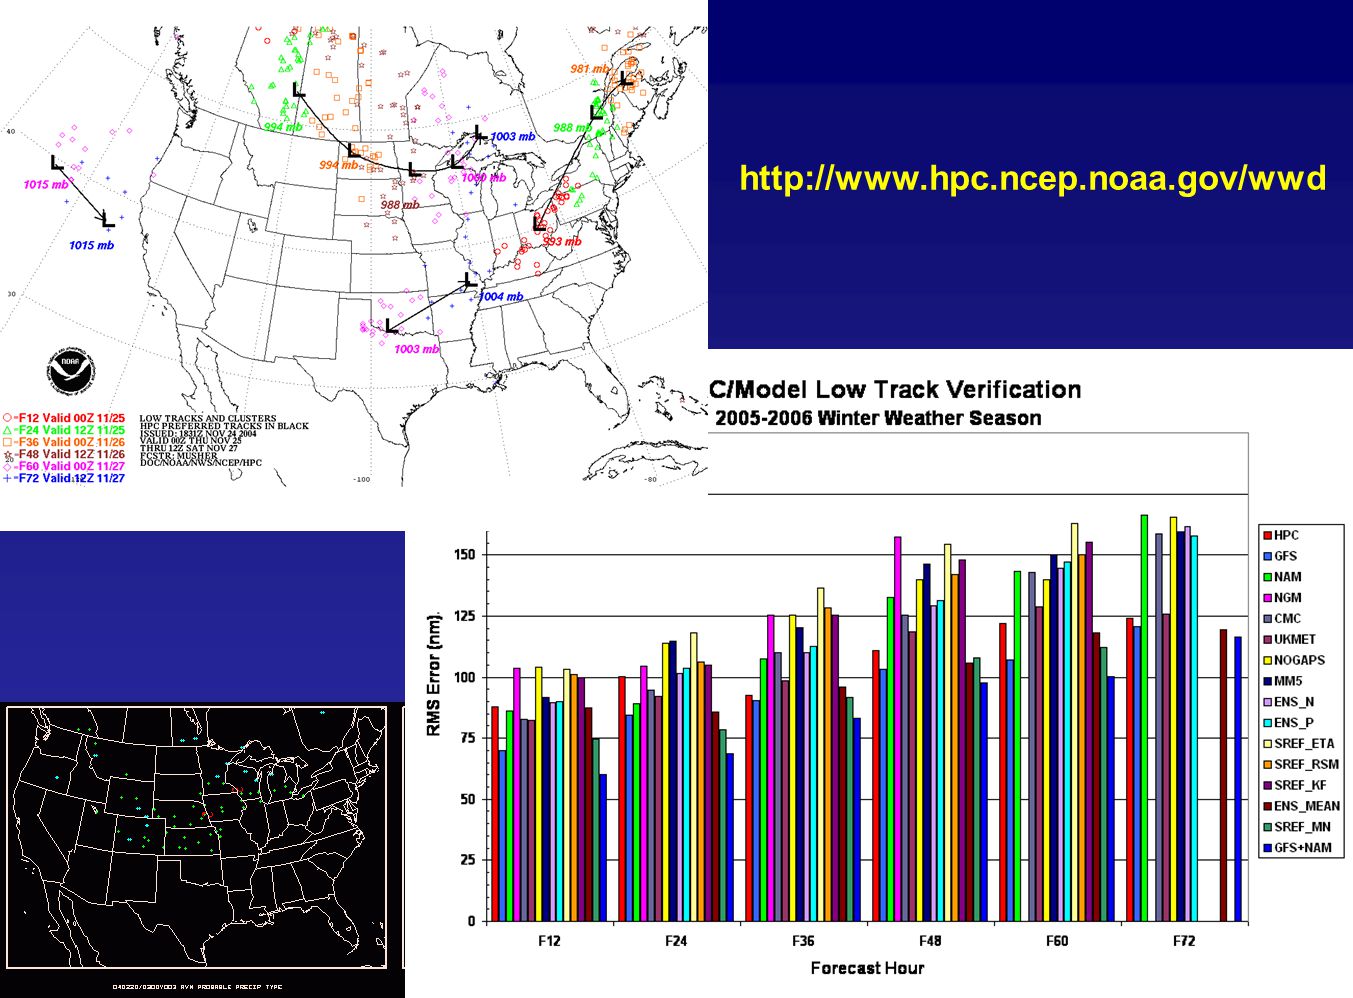
7
http://www.hpc.ncep.noaa.gov/wwd
8
Automated Guidance Automated ensemble products highlighting areas most likely to exceed critical thresholds http://www.hpc.ncep.noaa.gov/wwd/impactgraphics

9
Starting Point Forecaster selected blends to generate starting point grids

10
Targeted PDF Application Generation of probabilities by applying (centering) ensemble spread on manually generated deterministic forecast http://www.hpc.ncep.noaa.gov/ (winter weather, QPF, Medium Range)
 ensemble spread on manually generated deterministic forecast (winter weather, QPF, Medium Range)")
11
QPF Confidence Interval Max/Min QPF derived from HPC QPF and Characteristic uncertainty of current pattern http://www.hpc.ncep.noaa.gov/qpfci/qpfci.shtml

12
Model Info

13
NWS Modeling System - Short Term Road Map CCS – Central Computing System –New System being installed/tested –Slated to be operational Jan 07 – all CPU resources already earmarked for use GFS – Global Forecast System –T384/64L resolution, T190 after 180 hrs –No planned increases in resolution – conversion to hybrid sigma/p coordinate system, tweaks to init schemes and physics packages planned after CCS upgrade NAM – North American Mesoscale Model –WRF core run at 12km/60L res, non hydrostatic, sigma/p coordinate system –No short term planned increases to model res, tweaks to init schemes and physics packages intended after CCS upgrade GEFS – Global Ensemble Forecast System –14 members run at T126/L28 4x/day –Increase to 20 members and L64 after CCS upgrade –NAEFS will also increase to 16 CMC + 20 GEFS = 36 members after CCS upgrade SREF – Short Range Ensemble Forecast System –21 members run at approx 34km horiz res 4 cycles per day (posted to 40km res grib files) »10 Eta members, 5 RSM, 6 WRF –Intention to convert all members to WRF after CCS upgrade
 »10 Eta members, 5 RSM, 6 WRF –Intention to convert all members to WRF after CCS upgrade")
14
Monthly Synergy Meetings Informal meeting with –EMC, NCO, MMB, NCEP Service Centers, WFOs Near term model development and super computer/comm systems plans provided Users can anticipate and accommodate changes Highlights posted to web and emailed to “allsoos list” http://www.hpc.ncep.noaa.gov/html/model2.shtml#synergy

15
Downscaling to 5km

16
5km PRISM data is applied to 380 point forecasts to generate 5km forecast grid 5km Gridded MOS is being tested to replace PRISM data

17
NDFD D5 Max T HPC http://www.hpc.ncep.noaa.gov/5km_grids/5km_gridsbody.html

18
QPF related grids can be downscaled via PRISM as well Impact of downscaling on QPF related grids only occurs where significant gradients in terrain exist http://www.hpc.ncep.noaa.gov/wwd/internal

19
Questions ??? peter.manousos@noaa.gov 301 763 8000 x 7307

20
How do we get 5km detail from just 380 points ??? 5km PRISM data is used as a starting point Difference between HPC and PRISM data taken at all HPC forecast points (380) A “difference grid” (HPC – PRISM) is generated –Results in a 5km grid with little detail “Difference grid” is then added on top of the PRISM data
 A difference grid (HPC – PRISM) is generated –Results in a 5km grid with little detail Difference grid is then added on top of the PRISM data.")
21
Gotcha’s with mean/spread for QPF QPF “mean” can be misleading if output from individual members do not overlap each other

Similar presentations


 Great Lakes Operational Meteorological Workshop Dan Petersen, Wallace.>")


 2014 Review Tony Fracasso Acting Science and Operations Officer Contributions by Chris Bailey, Keith Brill, Jim Hayes,>")


 Baltimore-Washington Weather Forecast Office “Advances.>")


 Hydrometeorlogical Prediction Center (HPC) Forecast Operations Branch Winter Weather Desk Dan Petersen.>")

