Download presentation
Presentation is loading. Please wait.

1
ENERGY

2
WORLD ENERGY USAGE PER PERSON

3
ENERGY USE AND TYPES FOR LAST 400 YEARS

5
WORLD ENERGY RESOURCES TypeTotal EnergyPercent of » (Joules) global usage NON-RENEWABLE: Uranium1.6 x 10 23 4% Coal1.4 x 10 23 25 Tar/oil shale1.4 x 10 22 <1 Crude oil1 x 10 22 36 Natural Gas8 x 10 21 17
 global usage NON-RENEWABLE: Uranium1.6 x % Coal1.4 x Tar/oil shale1.4 x <1 Crude oil1 x Natural Gas8 x")
6
World Energy Resources RENEWABLE TypeJoules/year % usage Solar4 x 10 24 <1 Biomass2 x 10 21 >13 Hydroelectric9.2 x 10 19 5 Geothermal8 x 10 19 <0.1 Wind??<0.01

7
WORLD COAL Anthracite/Bituminous Proven Reserves (short tons) United States126,804 India90,826 China68,564 Nigeria54,586 Russia54,110
 United States126,804 India90,826 China68,564 Nigeria54,586 Russia54,110")
10
WORLD PETROLEUM Category(1991)USWORLD Reserves25950* Past Production551450 Through 1990 * In billions of barrels
USWORLD Reserves25950* Past Production Through 1990 * In billions of barrels")
11
WORLD PETROLEUM RESOURCES CRUDE OIL10 9 BARRELS 2003 DATA Saudi Arabia261.8 Canada180 Iraq112.5 UAE97.8 Kuwait96.5 Iran89.7 Venezuela77.8 Russia60 (US is 11 th with22.7)
")
13
NATURAL GAS COUNTRY10 12 CU. FT. Russia1,680 Iran812.3 Qatar508.54 Saudi Arabia224.7 UAE212.1 US186.95 Algeria159.7

16
US ENERGY SUPPLY AND USAGE

17
US ENERGY USAGE BY TYPE

18
US ENERGY USAGE BY ECONOMIC SECTOR

19
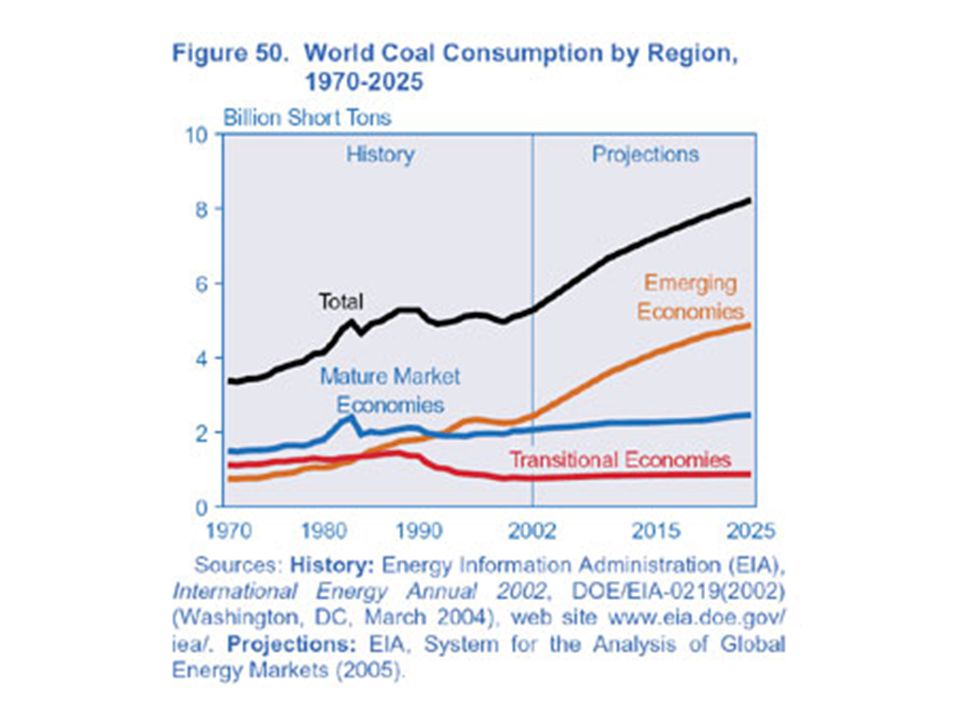
COAL USAGE IN US BY ECONOMIC SECTOR

20
OIL USAGE BY ECONOMIC SECTOR

21
US Gas Usage by Sector

22
ELECTRICITY USAGE IN US BY SECTOR

23
Drilling the ANWR will produce only 270,000 barrels per day for a couple of decades

24
Current Costs of Generating Energy

25
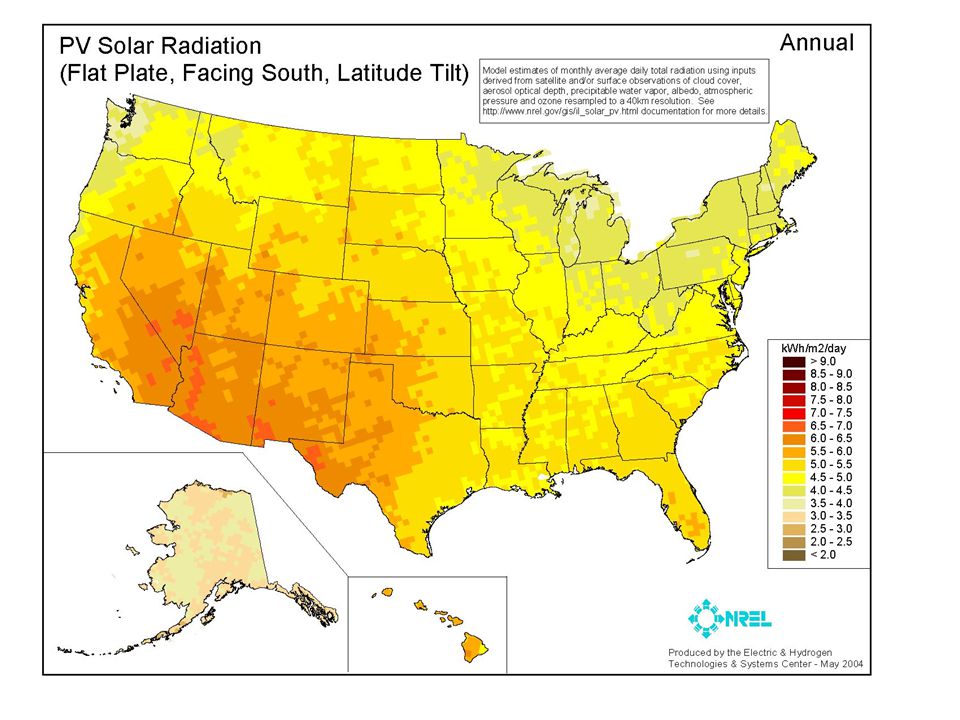
SOLAR ENERGY

26
NUCLEAR ENERGY

Similar presentations


 –Wind (turbines) –Water (hydropower)>")


. Content Objective: I will.>")