Download presentation
Presentation is loading. Please wait.

1
Transition Metal Complex Bonding and Spectroscopy Review

2
Bonding: Donor-Acceptor Interactions Roles of metal and ligands Making MO Diagrams for Complexes Counting d-electrons Filling in the MO Diagram High spin/Low spin cases Comparing structures for bond strength

3
Donor Acceptor MO Interactions

4
Roles: Metal d-orbitals = acceptors Ligands = donors MO Diagram in general:

5
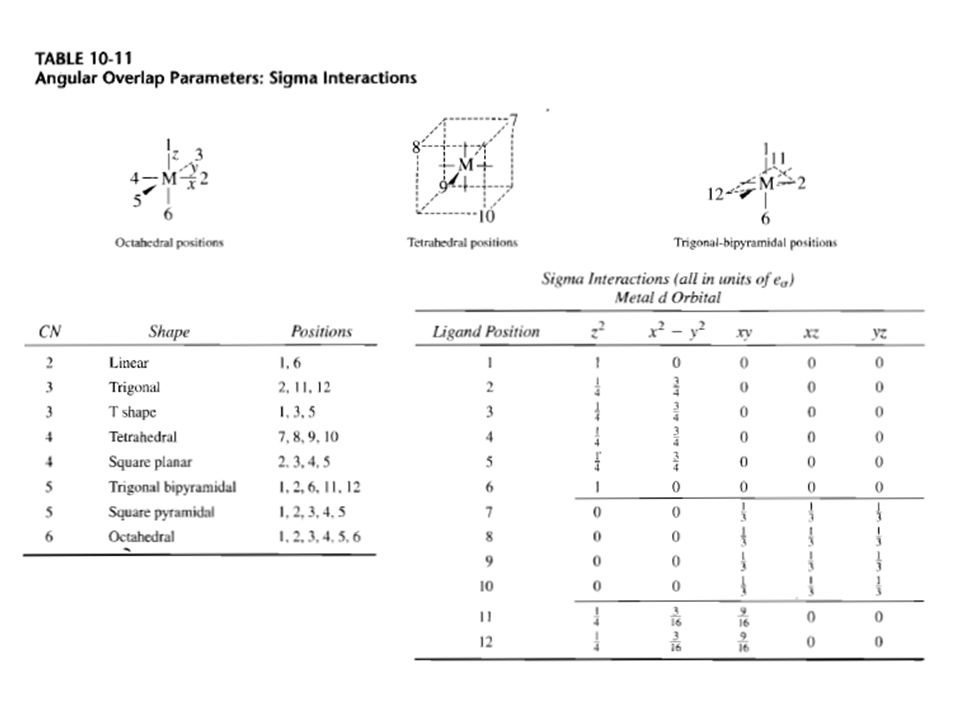
Specific Interactions for each d orbital based on ligand position
Use Angular Overlap parameters: --for each d-orbital, add up the interactions for all the ligands -- the total for that orbital determines how much higher its energy gets

7
Example: Linear shape: ligands at positions 1 and 6 dz2 dx2-y2 dxy dxz dyz 1+1 0 0 0 0
MO Diagram:

8
Example: Square pyramid shape: ligands at positions 1, 2, 3, 4, 5 dz dx2-y dxy dxz dyz 1+4(1/4) 4(3/4) MO Diagram:

9
Counting d electrons: Count over from Group 1A – size of positive charge Ti2+: V+: Co3+:

10
Filling in Electrons If gap is >=2, then need to consider high/low spin. If gap is <2, then it is always high spin. MO Diagram examples:

11
Comparing Overall Bond Order: Low spin case
Oh d6 case: Square pyramid d6 case:

12
Comparing Overall Bond Order: High spin case
Oh d6 case: Square pyramid d6 case:

13
Spectroscopy: 3 types of transitions 1. d-d transitions wavelength vs
Spectroscopy: 3 types of transitions d-d transitions wavelength vs. bond strength LMCT MLCT

14
Sigma Interaction Strength

15
LMCT with Pi Donor Ligands: Mainly oxides and halides

16
MLCT with Pi Acceptor Ligands and spectroscopy: CO, CN-, pyridine

Similar presentations


 Crystal Field Theory Considers only electrostatic interactions between the ligands and the.>")
![Slide 2/22 CHEM2402/2912/2916 [Part 2] A/Prof Adam Bridgeman Room: 222 Office.](/15/4658715/big_thumb.jpg "Slide 2/22 CHEM2402/2912/2916 [Part 2] A/Prof Adam Bridgeman Room: 222 Office.>")

>")


 Spectroscopy | Electronic | XPS UPS UV-visible.>")


>")
 influences their energy levels, and this.>")
