Download presentation
Presentation is loading. Please wait.

1
Basic Mathematics for Portfolio Management

2
Statistics Variables x, y, z Constants a, b Observations {x n, y n |n=1,…N} Mean

3
Variance

4
Covariance

5
Regression This is an example of a linear model. The model is unbiased if: How do we choose the best {a,b}?

6
Regression The best estimates for {a,b} should minimize the sum of squared errors: This corresponds to minimizing: Which leads to two equations:

7
Regression The first equation leads to an unbiased model. We can use this to solve for a:

8
Regression The second equation relates the coefficient b to the sample covariance of x and y: Putting this together: The model is the best linear unbiased estimate (BLUE), given only the sample data.
, given only the sample data.")
9
BLUE of y conditional on x More generally, the BLUE has the form: You can see how this directly relates to our prior regression result. We will apply this result more generally than just in the regression context. For example, our estimates of variances and covariances may improve upon sample estimates.

10
Linear Algebra Vectors and Matrices (We will denote in bold) Transpose Dimensions –(Rows x Columns) –Keep track of these Addition and Multiplication –Can only add matrices of identical dimension –For multiplication,
 Transpose Dimensions –(Rows x Columns) –Keep track of these Addition and Multiplication –Can only add matrices of identical dimension –For multiplication,")
11
Matrix Multiplication: AxB Move across A and down B

12
Hint 1 Keep track of the size of the matrices, to make sure the algebra makes sense:

14
Matrix Inverse

15
Using Linear Algebra Portfolio Variance

16
Multivariate Regression The multivariate linear model is: We can include an intercept as a column of X. To generalize, we minimize the weighted sum of squared errors: Our resulting estimates are:

17
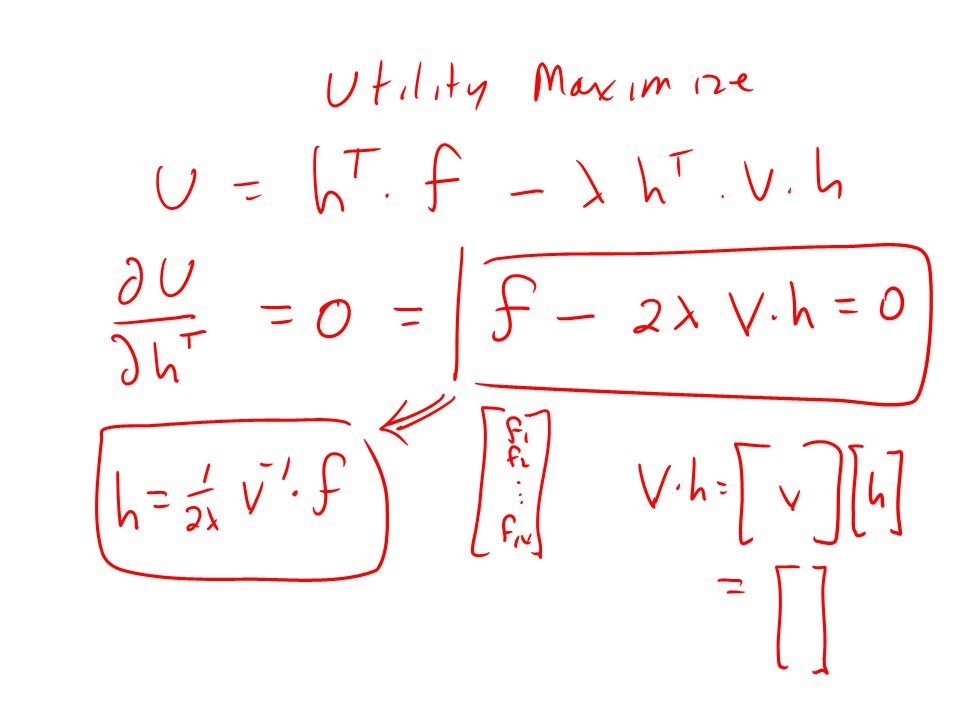
Basic Utility Function Mean/Variance What are the dimensions of U?

18
Portfolio Optimization Choose portfolio h to maximize U. What does that mean? We must take the derivative of U with respect to each of the N elements of h. That leads to N equations in N unknowns.

19
More Hints Hint 2: Try out 2x2 or 3x3 examples. Hint 3: To start, try working with individual elements. For example, I will use shorthand like: –This says to take derivatives with respect to each element of h. This should lead to N separate equations. –Example:

Similar presentations