Download presentation
Presentation is loading. Please wait.

1
Decide whether each sampling method is likely to result in a biased
Warm Up Decide whether each sampling method is likely to result in a biased sample. 1. The first 30 students to arrive at school are asked whether they will attend a dance. yes 2. Fifty students are randomly selected from the roster and asked whether they will attend a dance. no

2
Warm Up : Continued A café owner wants to know how many people in the area would come for Sunday brunch. She asks 20 customers that come for dinner on a Sunday. 3. Is the sample likely to be representative of the population? no

3
Objectives Estimate population means and proportions and develop margin of error from simulations involving random sampling. Analyze surveys, experiments, and observational studies to judge the validity of the conclusion.

4
Vocabulary simple random sample systematic sample stratified sample
cluster sample convenience sample self-selected sample probability sample margin of error

5
When a survey is used to gather data, it is important to consider how the sample is selected for the survey. If the sampling method is biased, the survey will not accurately reflect the population. Most national polls that are reported in the news are conducted using careful sampling methods in order to minimize bias.

6
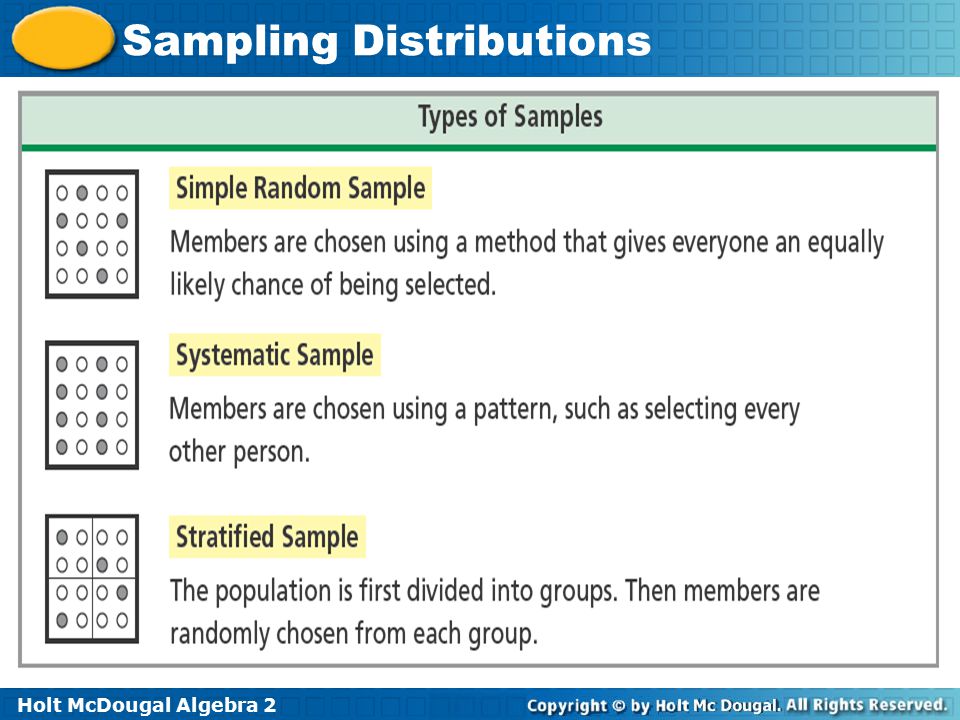
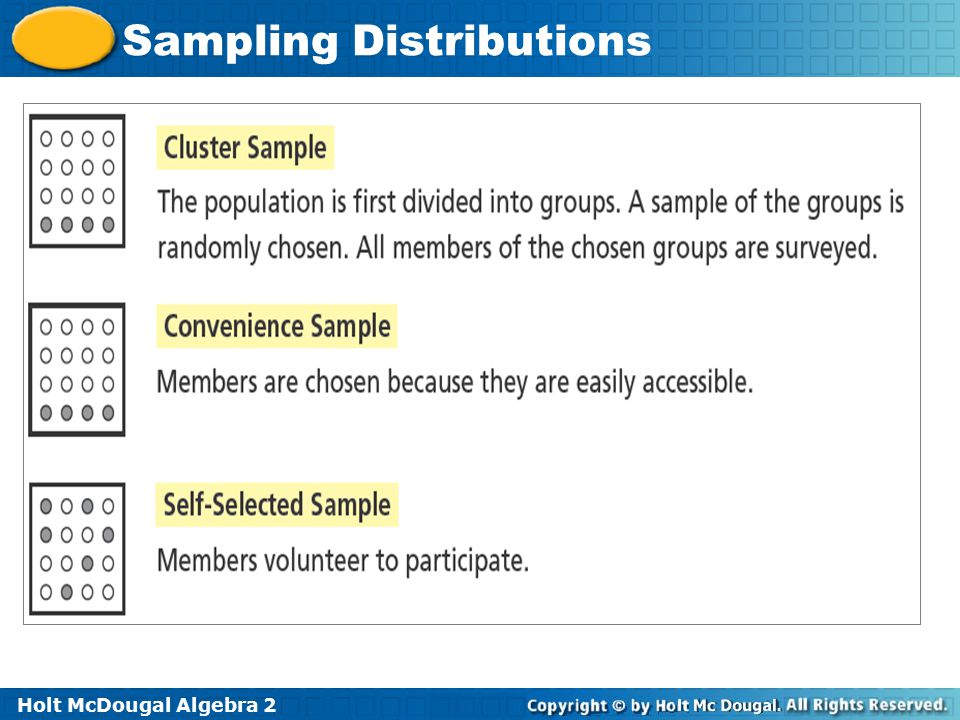
Other polls, such as those where people phone in to express their opinion, are not usually reliable as a reflection of the general population Remember that a random sample is one that involves chance. Six different types of samples are shown below.

9
Example 1:Classifying a Sample
The campaign staff for a state politician wants to know how voters in the state feel about a number of issues. Classify each sample. A. They call every 50th person on a list of registered voters in the state. This is a systematic sample as members are chosen using a pattern. B. They randomly select 100 voters from each county to Call. This is a stratified sample as the county is chosen and then voters are selected at random.

10
Example 1:Classifying a Sample continued
C. They ask every person who comes to the next campaign rally to fill out a survey. This is a convenience sample as the people at the rally are easily accessible.

11
Check It Out! Example 1 The editor of a snowboarding magazine wants to know the readers’ favorite places to snowboard. The latest issue of the magazine included a survey, and 238 readers completed and returned the survey. Classify the sample. This is a self-selected example as readers volunteered to participate.

12
A probability sample is a sample where every member of the population being sampled has a nonzero probability of being selected. Simple random samples, stratified samples, and cluster samples are all examples of probability sampling.

13
Example 2: Evaluating Sampling Methods
A community organization has 56 teenage members, 103 adult members, and 31 senior members. The council wants to survey the members. Classify each sampling method. Which is most accurate? Which is least accurate? Explain your reasoning. Method A Method B Method C Randomly select 60 people from the complete membership list. Choose every 5th person who arrives at the community clean-up event. Randomly select 20 teenagers, 20 adults, and 20 seniors from the complete roster.

14
Example 2:Continued Method A is the most accurate because every member of the population is equally likely to be in the sample. In Method C, the sample contains an equal number from each group, but the total numbers in each group differ significantly. So, adults are underrepresented and seniors are overrepresented. Method B is the least accurate because members who do not attend the cleanup have no chance of being included. Method A: simple random Method B: systematic Method C: Stratified

15
The margin of error of a random sample defines an interval, centered on the sample percent, in which the population percent is most likely to lie

16
Example 3: Interpreting a Margin of Error
A city is about to hold an election. According to a survey of a random sample of city voters, 42% of the voters plan to vote for Poe and 58% of the voters plan to vote for Nagel. The survey’s margin of error is ±7%. Does the survey clearly project the outcome of the voting? Between 35% and 49% of all voters plan to vote for Poe and between 51% and 65% of all voters plan to vote for Nagel. Because the intervals do not overlap, the survey does clearly project the outcome of the voting.

17
Check It Out! Example 3 A survey of a random sample of voters shows that 38% of voters plan to vote for Gonzalez, 31% of voters plan to vote for Chang, and 31% plan to vote for Harris. The survey has a margin of error of ±3%. Does the survey clearly project the outcome of the voting? Explain. Yes; while there is overlap between the intervals for Chang and Harris, their intervals, which are from 28% to 34%, do not overlap the interval for Gonzalez, which is 35% to 41%.

Similar presentations


 Select and Draw Conclusions from Samples Statistics Test: Oct. 20 (Wednesday)>")


 Then/Now New Vocabulary Example 1:Real-World Example: Classify a Random Sample Example.>")


