Download presentation
Presentation is loading. Please wait.

1
Statistics: Categorical Variables

2
Do Now: Give the context/ label the variables for the following situation: The Federal Aviation Administration (FAA) monitors airlines for safety and consumer service. For each flight the carrier must report the type of aircraft, the number of passengers, whether or not the flights departed/arrived on schedule and any mechanical problems.

3
Objectives Understand different ways to display categorical data. Understand the ways these displays can be misleading.

4
Categorical Variables: How can we graph them?!?

5
Graphing Categorical Data: 1. Frequency Table: records the totals and the category names 2. Relative Frequency Table: displays the percentages, rather than the counts, of the values in each category. How do we get percentages?

6
Other Options 3. Bar Chart: displays the distribution of a categorical variables, showing the counts for each category next to each other for easy comparison. 4. Relative Frequency Bar Chart: Guesses?

7
Other Options 3. Bar Chart: displays the distribution of a categorical variables, showing the counts for each category next to each other for easy comparison. 4. Relative Frequency Bar Chart: displays the distribution of categorical variables, showing the percentage for each category next to each other for easy comparison.

8
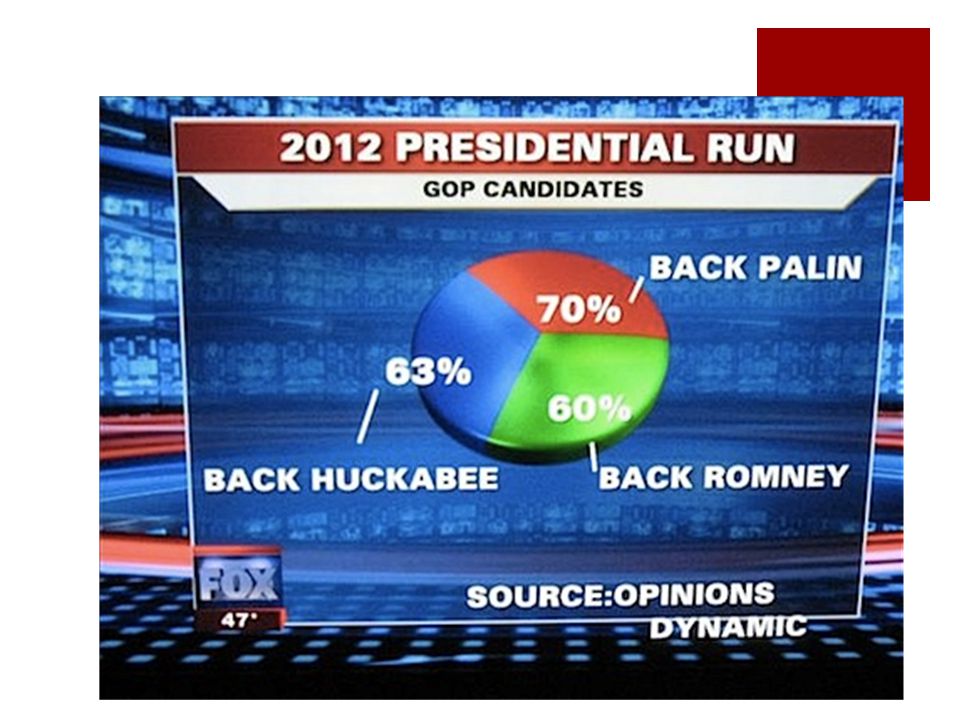
Alternatively 5. Pie Charts: show the whole group of cases as a circle. They slice the circle into pieces whose size is proportional to the fraction of the whole in each category.

9
Alternatively…. Segmented Bar Graph: treats each bar as the “whole” and divides it proportionally into segments corresponding to the percentages in each group.

10
Eye Color Survey Frequency Table: Relative Frequency Table: Pie Chart Vs. Segmented Bar Graph!

11
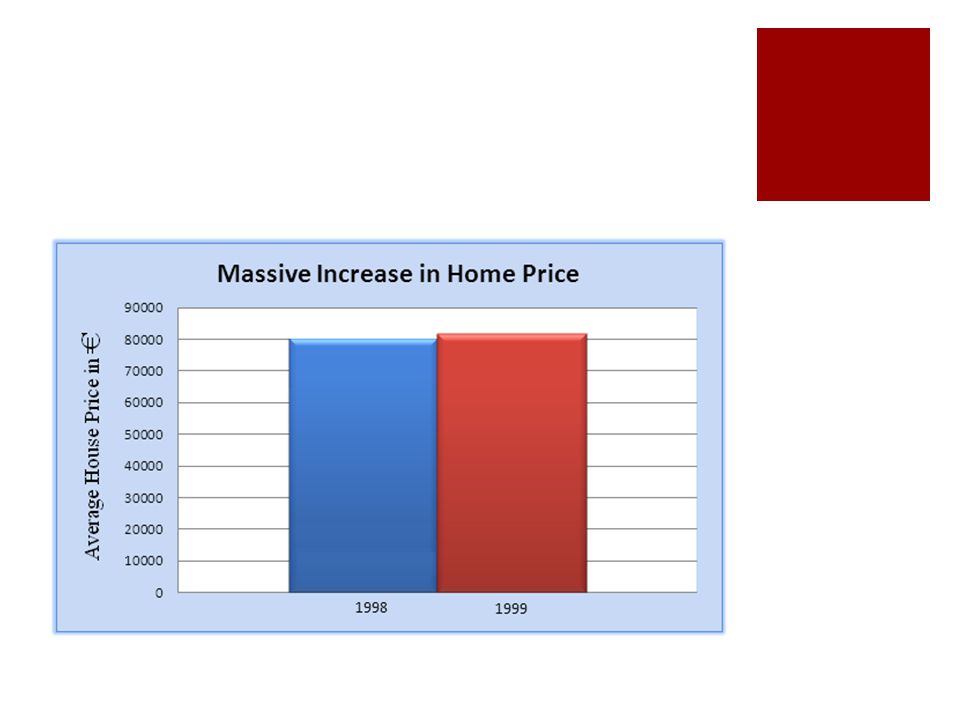
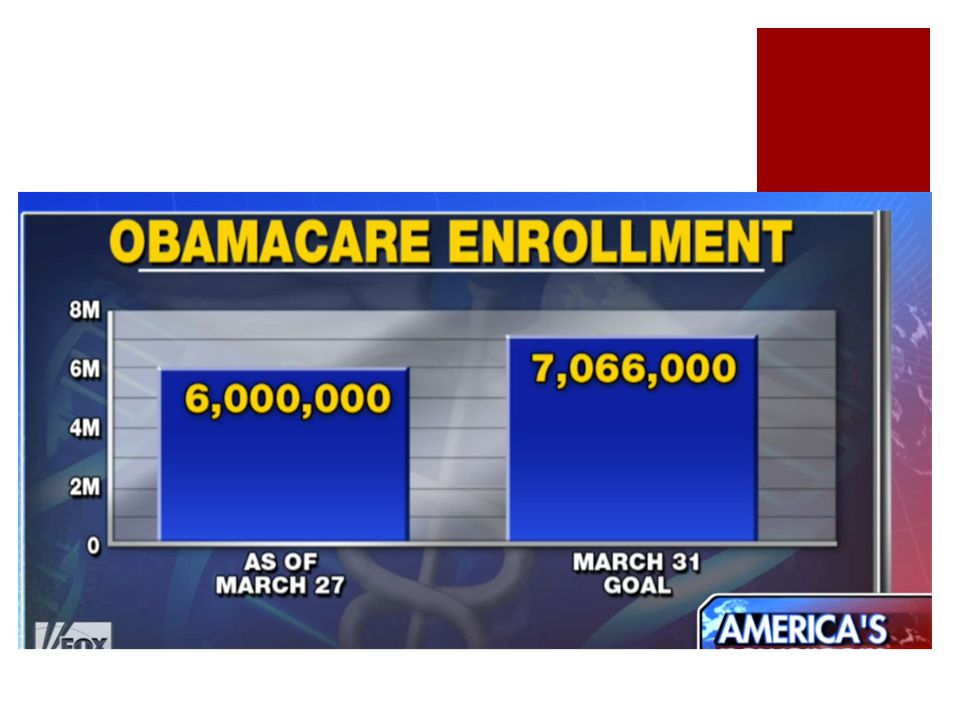
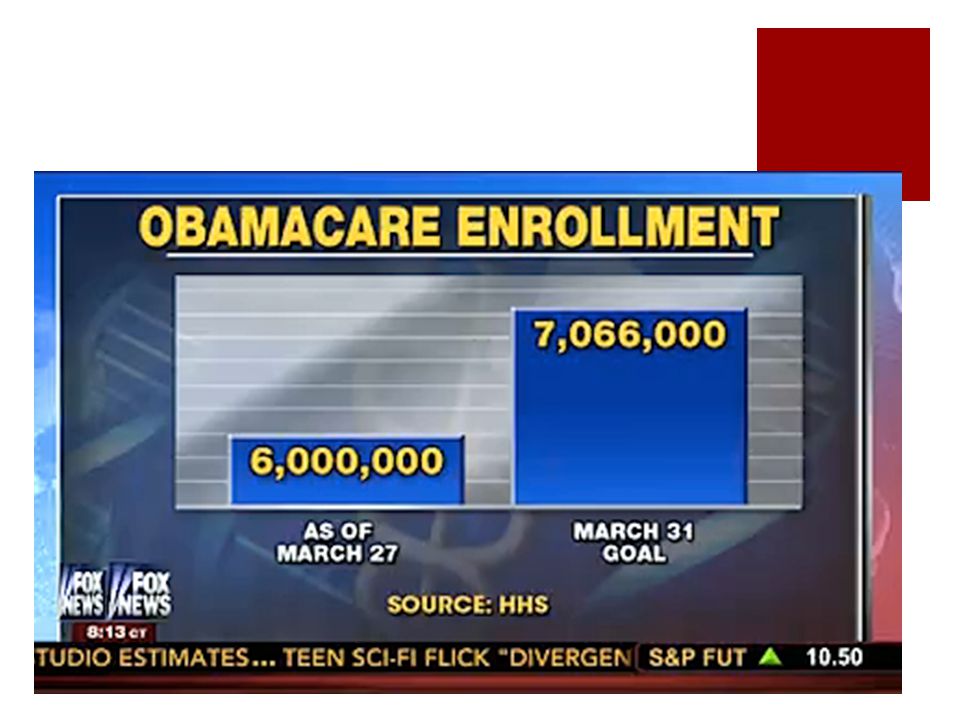
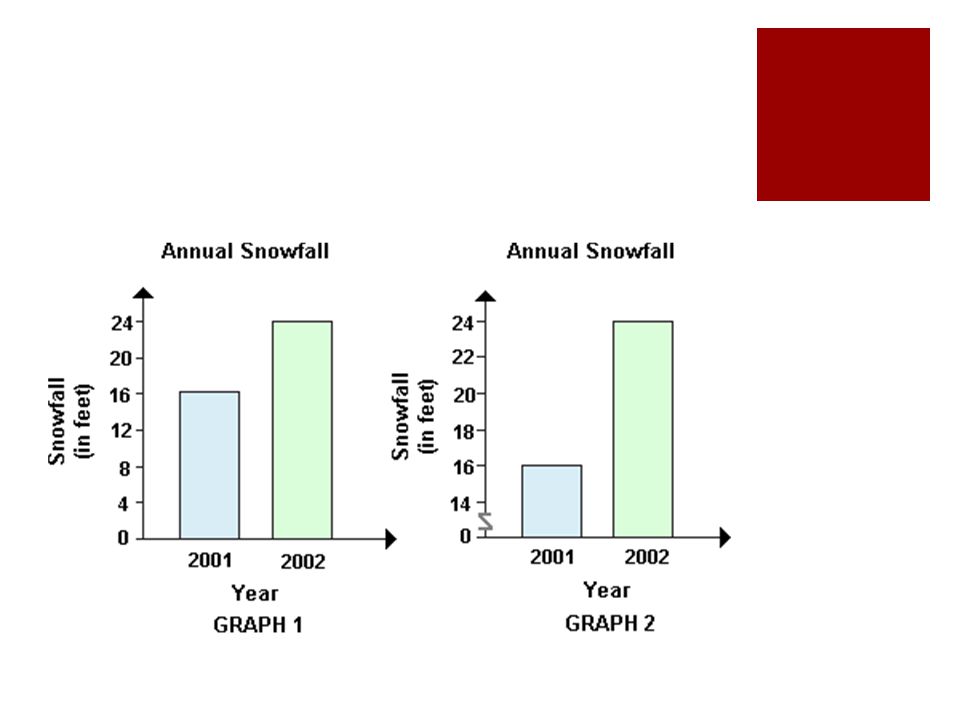
Graphs can be misleading:

17
Practice Problems: An article in the Winter 2003 issue of Chance Magazine reported on the Houston Independent School District’s Magnet Schools program. Of the 1755 qualified applicants, 931 were accepted, 298 were waitlisted, and 526 were turned away for lack of space. Find the relative frequency distribution of the decisions made, and write a sentence describing it.

18
Follow Up Question The Chance article also indicated that 517 applicants were Black or Hispanic, 292 were Asian, and 946 were White. Summarize the relative frequency distribution of ethnicity with a sentence of two.

19
Example Two:

Similar presentations


>")


