Download presentation
Presentation is loading. Please wait.

1
Chapter 16 Random Variables
Ashlynn Lamb 2nd

2
Random Variable Random variable assumes a value based on the outcome of a random event. X denotes random variable x denotes a particular value of a random variable Discrete random variables take one of a finite number of distinct outcomes Continuous random variables take any numeric value within a range of values

3
Probability Model probability model:
collection of all possible values of a random variable probabilities that the values occur. Of particular interest: the value we expect a random variable to take on, notated μ or E(X) for expected value
 for expected value.")
4
Variance and SD multiply each possible value by the probability that it occurs, and find the sum Square the variance

5
Changing a random variable by a constant
Adding/subtracting a constant from data shifts the mean but doesn’t change the variance or standard deviation: E(X ± c) = E(X) ± c Var(X ± c) = Var(X) multiplying each value of a random variable by a constant multiplies the mean by that constant and the variance by the square of the constant: E(aX) = aE(X) Var(aX) = a2Var(X)
 = E(X) ± c Var(X ± c) = Var(X) multiplying each value of a random variable by a constant multiplies the mean by that constant and the variance by the square of the constant: E(aX) = aE(X) Var(aX) = a2Var(X)")
6
Adding/Subtracting random variables
The mean of the difference of two random variables is the difference of the means. E(X ± Y) = E(X) ± E(Y) If the random variables are independent, the variance of their sum or difference is always the sum of the variances. Var(X ± Y) = Var(X) + Var(Y)
 = E(X) ± E(Y) If the random variables are independent, the variance of their sum or difference is always the sum of the variances. Var(X ± Y) = Var(X) + Var(Y)")
7
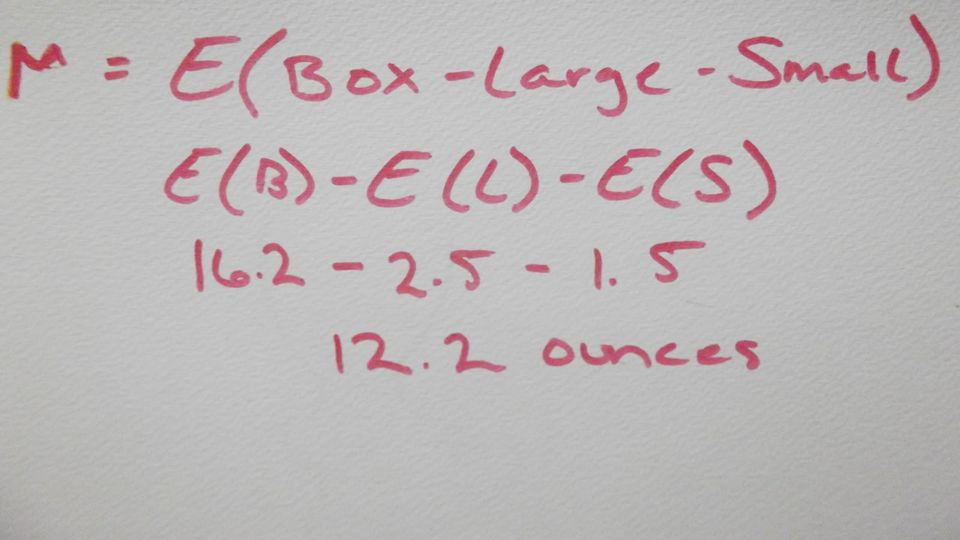
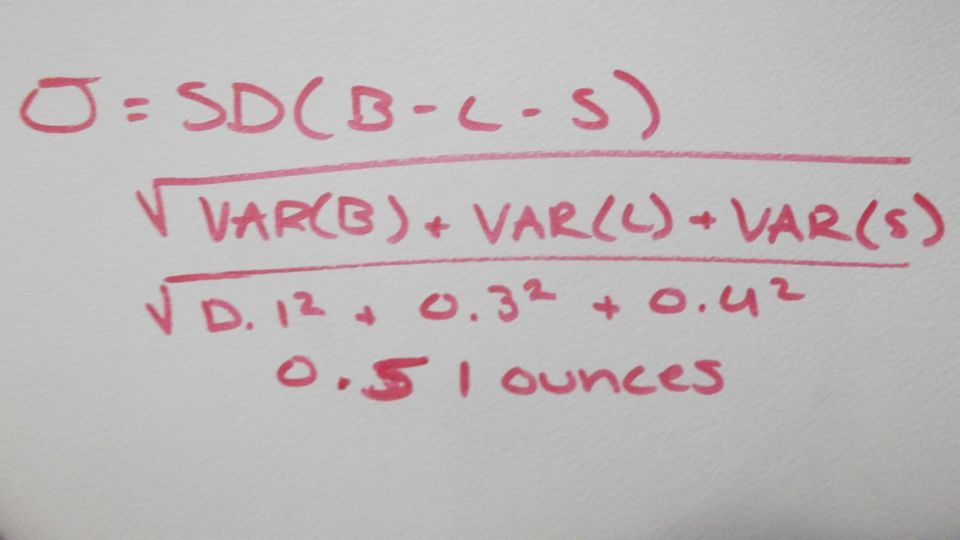
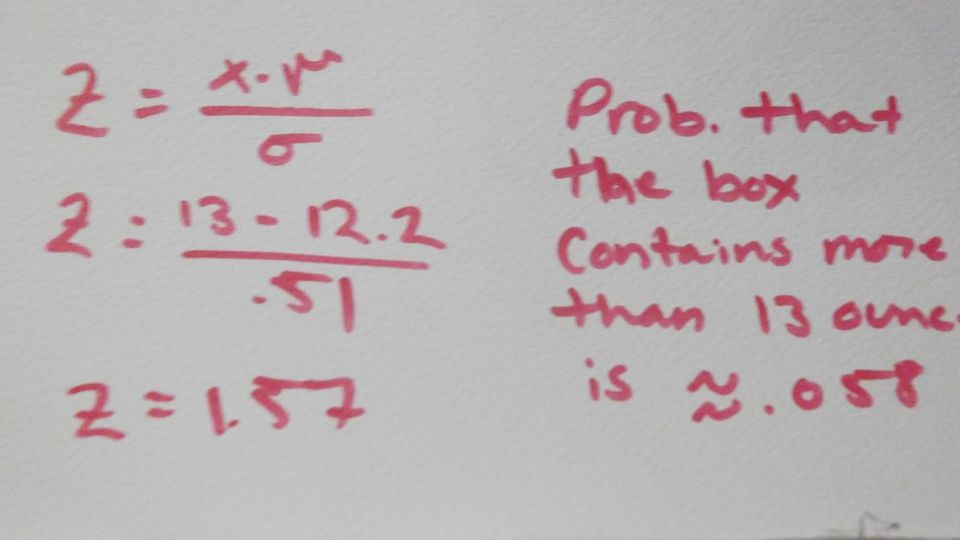
#35 In exercise 33, we poured a large and a small bowl of cereal from a box. Suppose the amount of cereal that the manufacturer puts in the boxes in a random variable with mean of 16.2 ounces, and a standard deviation 0.1 ounces find the expected value of cereal left in the box find the standard deviation what is the probability the box has more than 13 ounces

11
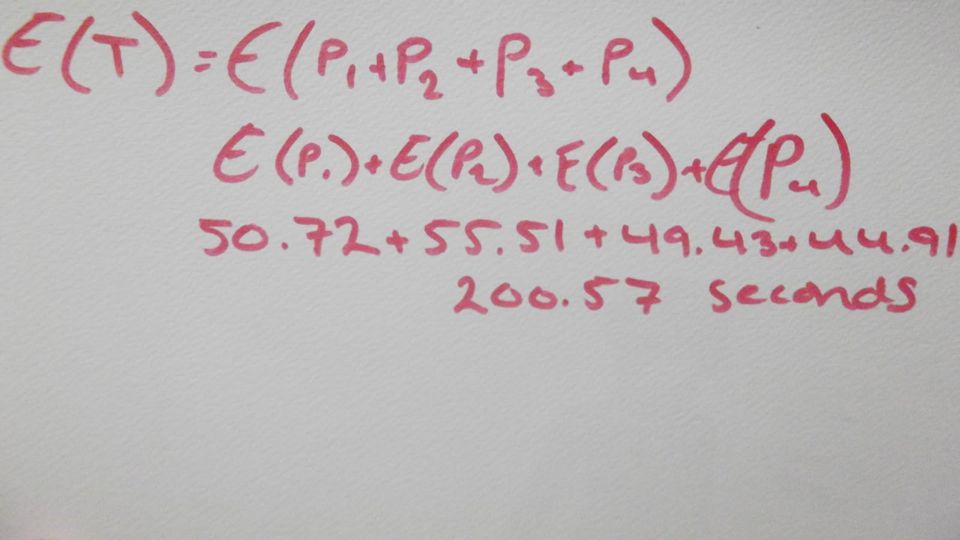
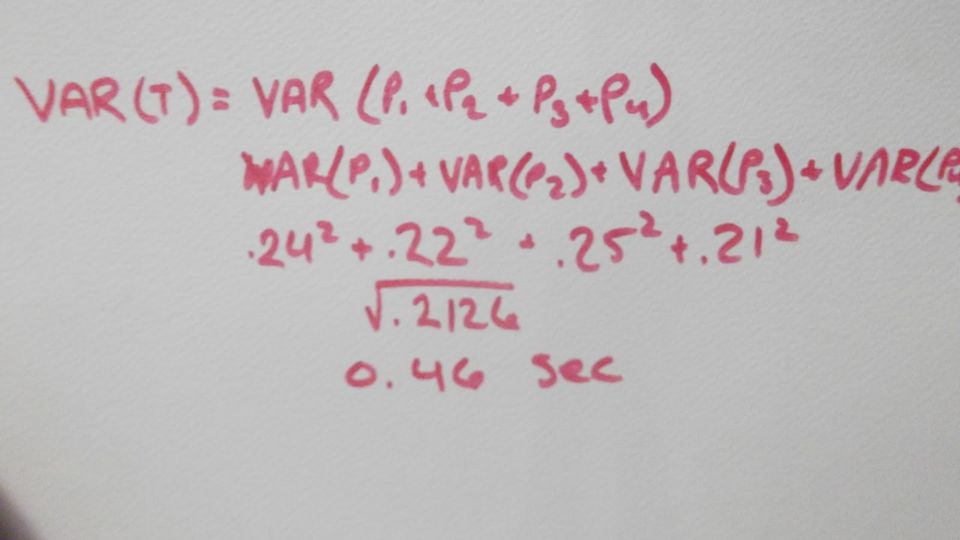
#37 In the 4X100 medley relay event, four swimmers swim 100 yards, each using a different stroke. A college team preparing for the conference championship looks at the times their swimmers have posted. Mean and SD are as shown: backstroke, M=50.72, SD= .24 breaststroke, M=55.51, SD= .22 butterfly, M=49.91, SD= .25 freestyle, M=44.91, SD= .21

12
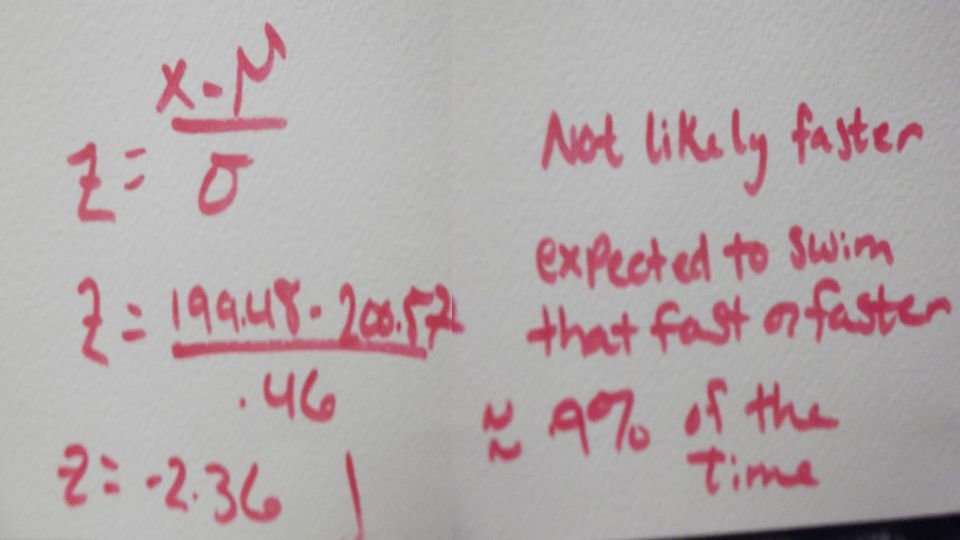
#37 cont. Find the mean and standard deviation for the relay team’s total time in this event The team’s best time so far this season was 3:19.48 ( seconds.) Do you think the team is likely to swim faster than this at the conference championship? Explain.
 Do you think the team is likely to swim faster than this at the conference championship Explain.")
Similar presentations