Download presentation
Presentation is loading. Please wait.

1
Chapter 11 – Part 1 Non-accelerated Motion Chapter 11.1-11.2
Physical Science Chapter 11 – Part 1 Non-accelerated Motion Chapter

2
Frame of Reference A system of objects that are not moving with respect to one another A reference point or system BASICALLY …. Something unchanging to measure things from Good frames of reference for measuring the motion of a car… The Earth, the road, buildings, trees Bad frames of reference for measuring the motion of a car…. Clouds, other cars on the road, bikers, flying birds

3
Relative Motion Movement in relation to a frame of reference
All Motion is Relative This means… all motion is based on someone’s or something’s perspective Examples School busses Cars on highway LabQuest

4
Relative Motion Or a more recent example

5
Measuring Distance Length of a path between two points
When an object moves in a straight line, the distance is the length of a line connecting the starting point and the ending point SI Unit – meters Other options- km, mi, cm

6
Displacement Distance with a direction How much an object is displaced
Distance – 5 kilometers Displacement – 5 Kilometers North How much an object is displaced When objects travel in a straight line the magnitude (amount) of the displacement is equal to the distance travelled When an object does not travel in a straight line, distance and displacement will be different
 of the displacement is equal to the distance travelled. When an object does not travel in a straight line, distance and displacement will be different.")
8
Vectors Scalar Quantities Vector Quantities 3 km + 3 km = 6 km
Have magnitude and direction Scalar Quantities Only have magnitude Vector quantities can be represented with arrows of a scaled length Length shows magnitude Arrow shows direction 3 km 3 km 3 km + 3 km = 6 km

9
Vectors & Scalars Scalars- Have only Magnitude Vectors-
Have Magnitude & Direction Scalars- Have only Magnitude Examples Displacement Distance Velocity Speed Acceleration Mass Force Time

10
Displacement in a straight line
4 km 7 km 4 km + 7 km = 11 km 8 km 5 km 8 km - 5 km = 3 km

11
Displacement that isn’t on a straight Path
Resultant Vector (red) – vector sum of 2 or more vectors 3 km 5 km 2 km Finding Distance Using Scalar Addition = 7 km Finding Displacement using Vector Addition = 5 km NE 1 km 1 km
 – vector sum of 2 or more vectors. 3 km. 5 km. 2 km. Finding Distance Using Scalar Addition = 7 km. Finding Displacement using Vector Addition = 5 km NE. 1 km. 1 km.")
12
These two vectors have the same ________________ and opposite ________________.

13
These two vectors have different ________________ but the same ________________.

14
These two vectors have the same ________________ AND the same ________________.

15
average Speed Average Speed is equal to distance divided by time 𝑣 𝑎𝑣𝑔 = 𝑑 𝑡 How fast or slow something is going A rate of motion

16
Instantaneous Speed Speed at a given moment of time
What the speedometer on a car reads

17
Constant Speed When speed is not changing
Instantaneous speed is equal to average speed at all times NOT Speeding up or slowing down Only ways to change speed is to speed up or slow down

18
Average Speed Constant Speed Instantaneous Speed
The Average speed over some time Maintaining the same speed all the time Speed of an object at a particular moment in time

19
Velocity Speed AND direction that an object is moving Vector Quantity
+ or – sign indicates which direction the velocity is + means North, Up, East, or to the Right - means South, Down, West, or to the left Sometimes multiple velocities can affect an objects motion Sailboat, airplanes These velocities combine with Vector Addition

20
Speed vs. Velocity Speed – tells how fast something is moving
Ex km/hr Velocity – tells how fast something is moving and its direction Ex. 35 mph North Can an object move with constant speed but have a changing velocity? Can an object move with constant velocity but have a changing speed?

21
2 ways to change Speed 3 ways to change Velocity Speed Up Slow Down Change Direction

22
acceleration Acceleration – The rate at which velocity changes
Can be described as …. Changes in Speed Changes in Direction OR change in both Speed and Direction Vector Quantity Units are meters per second per second or m/s2

23
3 Way to Accelerate Speed Up Slow Down Change Direction

24
Can an object moving with constant speed be accelerating?

25
Devices in Cars that lead to acceleration

26
Calculating Acceleration
𝑎= 𝑐ℎ𝑎𝑛𝑔𝑒 𝑖𝑛 𝑣𝑒𝑙𝑜𝑐𝑖𝑡𝑦 𝑡𝑜𝑡𝑎𝑙 𝑡𝑖𝑚𝑒 = ∆𝑣 𝑡 = 𝑣 𝑓 − 𝑣 𝑖 𝑡 Divide the change in velocity by total time

27
Example A car starts from rest and increases its speed to 25 m/s over the course of 10 seconds. What is the car’s acceleration? 𝑎= 𝑣 𝑓 − 𝑣 𝑖 𝑡 𝑣 𝑖 =0 𝑚 𝑠 𝑣 𝑓 =25 𝑚 𝑠 𝑡=10 𝑠𝑒𝑐 𝑎= (25 𝑚 𝑠 − 𝑚 𝑠 ) 10 𝑠𝑒𝑐 =2.5 m 𝑠 2
 10 𝑠𝑒𝑐 =2.5 m 𝑠 2.")
28
𝒂= 𝒗 𝒇 − 𝒗 𝒊 𝒕 𝒗 𝒊 =𝟏𝟎 𝒎 𝒔 𝒗 𝒇 =𝟑𝟐 𝒎 𝒔 𝒕=𝟑 𝒔𝒆𝒄
𝑎= (32 𝑚 𝑠 − 𝑚 𝑠 ) 3 𝑠𝑒𝑐 =7.33 m 𝑠 2
 3 𝑠𝑒𝑐 =7.33 m 𝑠 2.")
31
Graphs of motion Motion can also be depicted very well using graphs
Two types of graphs Displacement vs. time (D-t) graphs Velocity vs. time (V-t) graphs Straight,upward line on a V-t graph means constant acceleration Straight,upward line on D-t graph means constant velocity Displacement (m)
 graphs. Velocity vs. time (V-t) graphs. Straight,upward line on a V-t graph means constant acceleration. Straight,upward line on D-t graph means constant velocity. Displacement (m)")
32
D-t graph of constant ‘v’
Displacement increases at regular intervals, so constant velocity Graph below Increases displacement by 5 meters every sec. To find vel. on a disp.- time graph, find Slope

33
Slope 5 m/s Rise/run=slope= 25/5 = Rise = 25 Run = 5
Tells the rate of increase of the y-value as you move across the x values for any graph Slope = rise / run In other words… how much the graph goes up divided by how much the graph goes across Slope tells us properties of the motion being depicted On a displacement time graph slope = velocity On a velocity-time graph slope = acceleration Rise/run=slope= 25/5 = 5 m/s Rise = 25 If you took slope of smaller sections of the graph you would get the same answer since ‘v’ is constant Run = 5

38
Velocity- Time graphs v v. t graphs may look the same as some D v. t graphs, but the motion they describe can be very different because they deal with velocity, not distance. **The slope, of a Velocity v. Time graph indicates Acceleration**.

40
Distance-time graph of changing velocity
Time (s) Displacement (m) 1 8 2 11 3 18 4 15 5 25 What is v for 0-1 sec.?? What is v for 0-2 sec.?? What is v for 3-5 sec.?? What is v for 0-5 sec. ??
 Displacement (m) What is v for 0-1 sec. What is v for 0-2 sec. What is v for 3-5 sec. What is v for 0-5 sec.")
41
Distance-time graph of constant acceleration
Parabola….. If + acc, line keeps getting steeper and steeper d t

42
Avg. velocity from 0-1 sec. ? 4 m/s
Avg. vel. From 3-4 sec? 16.5 Acc. From 2-3 sec? 7 m/s2

43
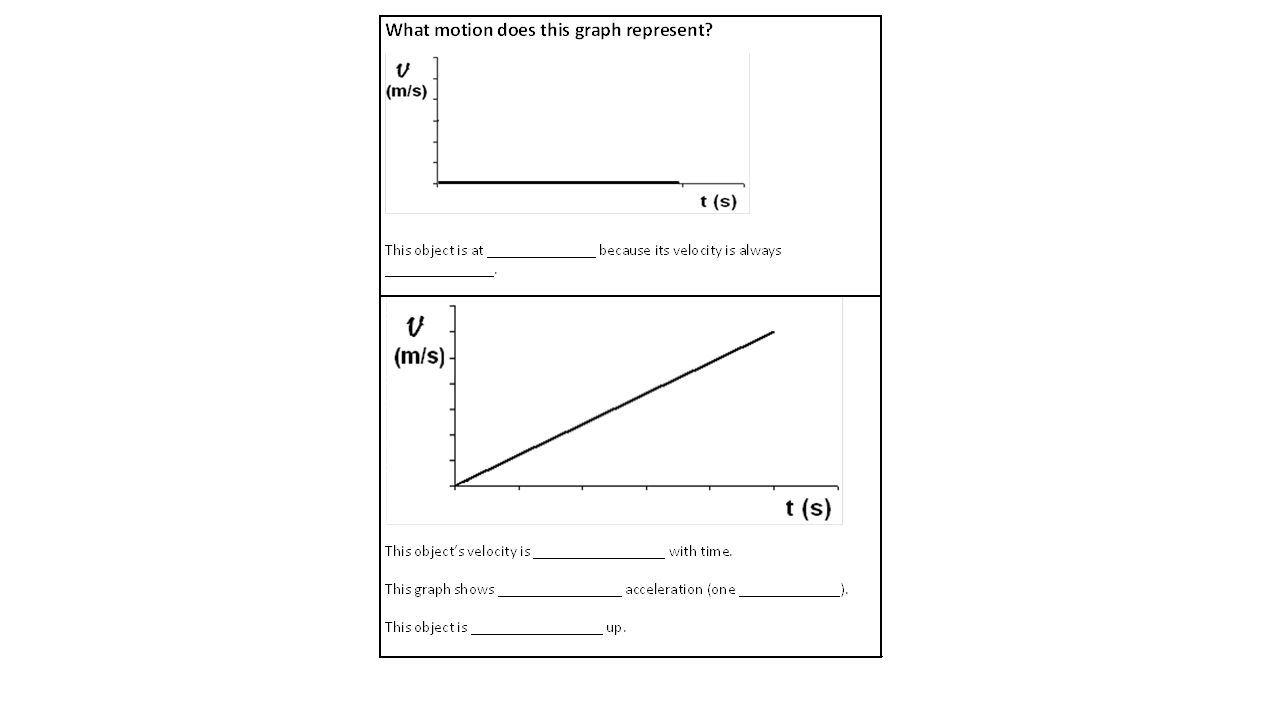
Velocity vs. Time graph of constant acceleration
Velocity (m/s)
")
44
Position –time Graph Slope = rise/run … Rise = Run = Rise/run = 50 5
10 m/s = speed Speed-time graph Slope = rise/run … Rise = 16 Run = 4 Rise/run = 4 m/s = acceleration

45
Free Fall Acceleration
As objects fall toward the Earth they are accelerating at a rate of 9.8 m/s2 downward We can usually round 9.8 m/s2 to 10 m/s2 Objects in free fall will gain 10 m/s of speed for every 1 second it is falling Time (sec) Instantaneous Speed (m/s) Acceleration (m/s2) 10 1 2 20 3 30 4 40
 Instantaneous Speed (m/s) Acceleration (m/s2)")
46
Free Fall Acceleration
Object is in free-fall any time it is ONLY under the influence of gravity Including when something is thrown upwards All objects (regardless of mass) fall at the same rate on Earth, when air resistance is ignored Ball thrown upward with initial velocity of +30 m/s Time (sec) Instantaneous Vel. (m/s) Acceleration (m/s2) +30 -10 1 +20 2 +10 3 4 5 -20 6 -30
 fall at the same rate on Earth, when air resistance is ignored. Ball thrown upward with initial velocity of +30 m/s. Time (sec) Instantaneous Vel. (m/s) Acceleration (m/s2)")
Similar presentations


 General Physics (PHYS101) Sections 30 and 33 are canceled.>")


