Download presentation
Presentation is loading. Please wait.

1
Warm Up: Get out the Unemployment Handout from Monday
Warm Up: Get out the Unemployment Handout from Monday. Have you completed it?

2
Warm Up In the following scenarios, has inflation created: (a) winners and losers at no net cost to the economy, or (b) a net cost to the economy? If you have chosen (b), which type of cost is the inflation generating? 1. During a period of rapid unexpected inflation, Sam’s Meat Market must change the price of his products on a weekly basis. 2. The First Bank of Reffville has made many long-term loans with fixed interest rates assuming a stable inflation of 3% every year. For the last two years inflation has been even lower at 1.5%.
 winners and losers at no net cost to the economy, or (b) a net cost to the economy If you have chosen (b), which type of cost is the inflation generating 1. During a period of rapid unexpected inflation, Sam’s Meat Market must change the price of his products on a weekly basis. 2. The First Bank of Reffville has made many long-term loans with fixed interest rates assuming a stable inflation of 3% every year. For the last two years inflation has been even lower at 1.5%.")
3
Inflation: Module 14 & 15 WHAT IS INFLATION?

4
Inflation is a general rising level of prices
It reduces the “purchasing power” of money Examples: It takes $2 to buy today what $1 bought in 1982 It takes $6 to buy today what $1 bought in 1961 When inflation occurs, each dollar of income will buy fewer goods than before.

5
Inflation rate = Price level in year 2 – Price level in year 1 x 100
The Natural Rate The real wage is the wage rate divided by the price level. Real income is income divided by the price level. The inflation rate is the percent increase in the overall level of prices per year. Inflation rate = Price level in year 2 – Price level in year 1 x 100 Price level in year 1

6
Inflation and Deflation
The Price Level versus the Inflation Rate, 1968–2009

7
Inflation and Deflation
High rates of inflation impose significant economic costs. Shoe-leather costs are the increased costs of transactions caused by inflation. Menu cost is the real cost of changing a listed price. Unit-of-account costs arise from the way inflation makes money a less reliable unit of measurement.

8
Winners and Losers from Inflation
Inflation changes the dollar repayment of a loan will be because the loan contract is stated in nominal terms. The nominal interest rate is the interest rate expressed in dollar terms. The real interest rate is the nominal interest rate minus the rate of inflation. If inflation is higher than expected, borrowers gain at the expense of lenders. If inflation is lower than expected, lenders gain at the expense of borrowers. Unexpectedly high rates of inflation hurt lenders and benefit borrowers. If inflation rate gets too high, the process of reducing (disinflation) can be painful for the economy.
 can be painful for the economy.")
9
Common Student difficulties
Don’t assume that inflation hurts everyone in the economy, when it in fact can serve as a distribution of income form those that are hurt, to those that are hurt, to those that gain, from rising prices. The difference between nominal and real values is important, and not always intuitive.

10
Cost-of-Living-Adjustment (COLA)
Hurt by Inflation Helped by Inflation Lenders-People who lend money (at fixed interest rates) People with fixed incomes Savers Borrowers-People who borrow money A business where the price of the product increases faster than the price of resources Cost-of-Living-Adjustment (COLA) Some works have salaries that mirror inflation. They negotiated wages that rise with inflation
 People with fixed incomes. Savers. Borrowers-People who borrow money. A business where the price of the product increases faster than the price of resources. Cost-of-Living-Adjustment (COLA) Some works have salaries that mirror inflation. They negotiated wages that rise with inflation.")
11
Nominal Interest Rates-
What are interest rates? Why do lenders charge them? Who is willing to lend me $100 if I will pay a total interest rate of 100%? (I plan to pay you back in 2050) If the nominal interest rate is 10% and the inflation rate is 15%, how much is the REAL interest rate? Real Interest Rates- The percentage increase in purchasing power that a borrower pays. (adjusted for inflation) Real = nominal interest rate - expected inflation Nominal Interest Rates- the percentage increase in money that the borrower pays not adjusting for inflation. Nominal = Real interest rate + expected inflation
 If the nominal interest rate is 10% and the inflation rate is 15%, how much is the REAL interest rate Real Interest Rates- The percentage increase in purchasing power that a borrower pays. (adjusted for inflation) Real = nominal interest rate - expected inflation. Nominal Interest Rates- the percentage increase in money that the borrower pays not adjusting for inflation. Nominal = Real interest rate + expected inflation.")
12
Nominal vs. Real Interest Rates
Example #1: You lend out $100 with 20% interest. Inflation is 15%. A year later you get paid back $120. What is the nominal and what is the real interest rate? Nominal interest rate is 20%. Real interest rate was 5% In reality, you get paid back an amount with less purchasing power. Example #2: You lend out $100 with 10% interest. Prices are expected to increased 20%. In a year you get paid back $110. Nominal interest rate is 10%. Real rate was –10%

13
Inflation is Easy; Disinflation is Hard
Disinflation is the process of bringing the inflation rate down.

14
Israel’s Experience with Inflation
In the mid-1980s, Israel experienced a “clean” inflation. But policy errors led to very high inflation. The shoe-leather costs of inflation were substantial. Israelis spent a lot of time moving money in and out of bank accounts that provided high enough interest rates to offset inflation. Businesses made efforts to minimize menu costs. For example, restaurant menus often didn’t list prices. It was hard for Israelis to make decisions because prices changed so much and so often.

15
The rate of change of prices is important in the economy.
A high inflation rate imposes overall costs on the economy: shoe-leather costs, menu costs, and unit-of-account costs. Inflation does not, as many assume, make everyone poorer by raising the level of prices because wages and incomes are adjusted to take into account a rising price level, leaving real wages and real income unaffected. A higher-than-expected inflation rate is good for borrowers and bad for lenders. A lower-than expected inflation rate is good for lenders and bad for borrowers. Disinflation is very costly, so policy makers try to prevent inflation from becoming excessive in the first place.

16
Price Level versus the Inflation Rate, 1969–2009…
Price Level versus the Inflation Rate, 1969–2009….Notice how by 2009 costs of items are much higher than the actual inflation rate thus reducing the purchasing power of the consumer.

17
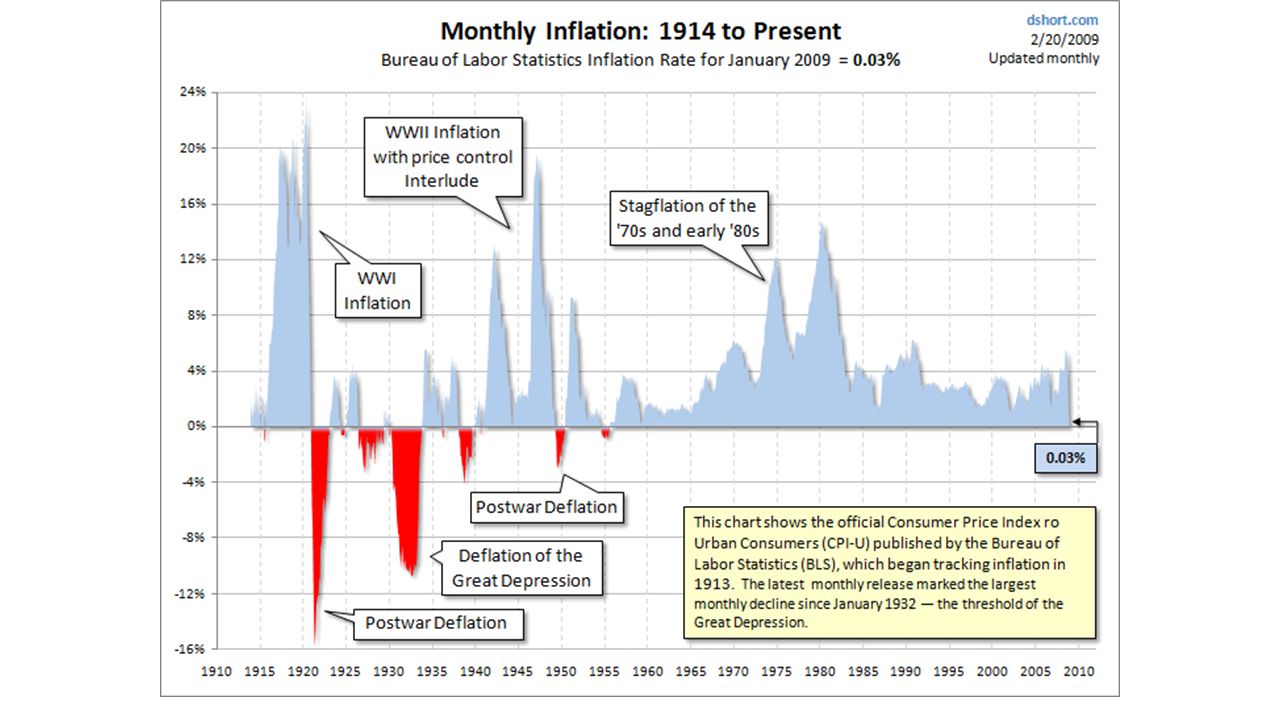
Notice the “Stagflation Era” of the early 1980s.

18
How is Inflation measured? (Module 15)
The government tracks the prices of the same goods and services each year. This “market basket” is made up of about 300 commonly purchased goods The Inflation Rate-% change in prices in 1 year Then compare changes in prices to a given base year (usually 1982) Prices of subsequent years are then expressed as a percentage of the base year Examples: 2005 inflation rate was 3.4% U.S. prices have increase 98.3% since 1982 (base year).
 Prices of subsequent years are then expressed as a percentage of the base year. Examples: 2005 inflation rate was 3.4% U.S. prices have increase 98.3% since 1982 (base year).")
19
World Inflation Rates

20
Historic Inflation Rates

23
Price Indexes and the Aggregate Price Level
To determine the aggregate price level, we use a Market Basket. A price index is the ratio of the current cost of that market basket to the cost in a base year, multiplied by 100.

24
The most commonly used method to determine inflation for consumers is the Consumer Price Index
Here is how it works: The base year is given an index of 100 To compare, each year is given an index # as well = Price of market basket in base year x 100 CPI Price of market basket Market Basket: Movie is $6 & Pizza is $14 Total = $20 (Index of Base Year = 100) Market Basket: Movie is $8 & Pizza is $17 Total = $25 (Index of 125) This means inflation increased 25% b/w ’97 & ‘09 Items that cost $100 in ’97 cost $125 in ‘09
 2009 Market Basket: Movie is $8 & Pizza is $17. Total = $25 (Index of 125) This means inflation increased 25% b/w ’97 & ‘09. Items that cost $100 in ’97 cost $125 in ‘09.")
25
The CPI, 1913–2009

26
The Market Basket of Goods used to compute the Consumer Price Index in 2008.

27
Inflation Rate, CPI, and other Indexes
The inflation rate is the yearly percentage change in a price index, typically based upon Consumer Price Index, or CPI, the most common measure of the aggregate price level. The CPI measures the cost of the market basket of a typical urban American family.

28
Table Calculating the Cost of a Market Basket Krugman and Wells: Macroeconomics, Second Edition in Modules Copyright © 2012 by Worth Publishers

29
Example on the board

30
Figure The CPI, the PPI, and the GDP Deflator Krugman and Wells: Macroeconomics, Second Edition in Modules Copyright © 2012 by Worth Publishers

31
Market Baskets and Price Indexes
Calculating GDP and Real GDP in a Simple Economy Pre-frost Post-frost Price of orange $0.20 $0.40 Price of grapefruit 0.60 1.00 Price of lemon 0.25 0.45 Cost of market basket (200 × $0.20) + (200 × $0.40) + (200 oranges, 50 grapefruit, (50 × $0.60) + (50 × $1.00) + 100 lemons) (100 × $0.25) = $95.00 (100 × $0.45) = $175.00 Table 15.1: Calculating the Cost of a Market Basket
 + (200 × $0.40) + (200 oranges, 50 grapefruit, (50 × $0.60) + (50 × $1.00) lemons) (100 × $0.25) = $ (100 × $0.45) = $ Table 15.1: Calculating the Cost of a Market Basket.")
32
Other Price Measures A similar index to CPI for goods purchased by firms is the producer price index. Economists also use the GDP deflator, which measures the price level by calculating the ratio of nominal to real GDP. The GDP deflator for a given year is 100 times the ratio of nominal GDP to real GDP in that year.

33
CPI vs. GDP Deflator The GDP deflator measures the prices of all goods produced, whereas the CPI measures prices of only the goods and services bought by consumers. An increase in the price of goods bought by firms or the government will show up in the GDP deflator but not in the CPI. The GDP deflator includes only those goods and services produced domestically. Imported goods are not a part of GDP and therefore don’t show up in the GDP deflator. = Real GDP x 100 GDP Deflator Nominal GDP If the nominal GDP in ’09 was 25 and the real GDP (compared to a base year) was 20 how much is the GDP Deflator?
 was 20 how much is the GDP Deflator")
34
Calculating GDP Deflator
= Real GDP x 100 GDP Deflator Nominal GDP = 100 Nominal GDP (Deflator) x (Real GDP)
 x (Real GDP)")
35
The CPI, the PPI, and the GDP Deflator
Figure Caption: Figure 15.3: The CPI, the PPI, and the GDP Deflator As the figure shows, these three different measures of inflation usually move closely together. Each reveals a drastic acceleration of inflation during the 1970s and a return to relative price stability in the 1990s. Sources: Bureau of Labor Statistics; Bureau of Economic Analysis.

36
Indexing to the CPI The CPI has a direct and immediate impact on millions of Americans. Many payments are tied, or “indexed,” to the CPI. Today, 48 million people receive checks from Social Security. In addition, all Social Security payments are adjusted each year to offset any increase in consumer prices over the previous year. The CPI is used to calculate the official estimate of the inflation rate used to adjust these payments yearly.

37
To measure the aggregate price level, economists calculate the cost of purchasing a market basket.
A price index is the ratio of the current cost of that market basket to the cost in a selected base year, multiplied by 100. The inflation rate is the yearly percent change in a price index, typically based on the consumer price index the most common measure of the aggregate price level. A similar index for goods and services purchased by firms is the producer price index. Finally, economists also use the GDP deflator, which measures the price level by calculating the ratio of nominal to real GDP times 100.

38
So What Do You Actually Understand?
Modules Review Questions

41
51. GDP is: A) the monetary value of all goods and services (final, intermediate, and non-market) produced in a given year. B) total resource income less taxes, saving, and spending on exports. C) the economic value of all economic resources used in the production of a year's output. D) the market value of all final goods and services produced within a nation in a specific year. 52. GDP can be calculated by summing: A) consumption, investment, government purchases, exports, and imports. B) consumption, investment, government purchases, and imports. C) investment, government purchases, consumption, and net exports. D) consumption, investment, wages, and rents.
 total resource income less taxes, saving, and spending on exports. C) the economic value of all economic resources used in the production of a year s output. D) the market value of all final goods and services produced within a nation in a specific year. 52. GDP can be calculated by summing: A) consumption, investment, government purchases, exports, and imports. B) consumption, investment, government purchases, and imports. C) investment, government purchases, consumption, and net exports. D) consumption, investment, wages, and rents.")
42
53. Net exports are negative when:
A) a nation's imports exceed its exports. B) the economy's stock of capital goods is declining. C) depreciation exceeds domestic investment. D) a nation's exports exceed its imports. E) the government increases trade barriers 54. Historically, real GDP has increased less rapidly than nominal GDP because: A) price indices have not reflected improvements in product quality. B) the general prices have increased. C) technological progress has resulted in more efficient production. D) the general prices have declined. E) nominal GDP is adjusted for inflation
 a nation s imports exceed its exports. B) the economy s stock of capital goods is declining. C) depreciation exceeds domestic investment. D) a nation s exports exceed its imports. E) the government increases trade barriers. 54. Historically, real GDP has increased less rapidly than nominal GDP because: A) price indices have not reflected improvements in product quality. B) the general prices have increased. C) technological progress has resulted in more efficient production. D) the general prices have declined. E) nominal GDP is adjusted for inflation.")
43
55. Which of the following best measures a nation’s standard of living:
A) unemployment rate. B) nominal GDP. C) total consumption and government spending D) real GDP per capita. E) inflation rate 56. The phase of the business cycle in which real GDP declines for at least 2 quarters is called: A) the peak. B) a recovery. C) a recession. D) the trough. E) a depression
 unemployment rate. B) nominal GDP. C) total consumption and government spending. D) real GDP per capita. E) inflation rate. 56. The phase of the business cycle in which real GDP declines for at least 2 quarters is called: A) the peak. B) a recovery. C) a recession. D) the trough. E) a depression.")
44
57. Assuming the total population is 100 million, the civilian labor force is 50 million, and 47 million workers are employed, the unemployment rate: A) is 3 percent. B) is 6 percent. C) is 7 percent. D) is 9 percent. E) cannot be determined because we do not know how many workers are retired. 58. Which of the following is correct? A) The unemployment rates of men and women workers are roughly the same. B) Unemployment rates for black and white workers are approximately the same. C) Teenagers experience approximately the same unemployment rates as do adults. D) Laborers are less vulnerable to unemployment than are professional workers.
 is 3 percent. B) is 6 percent. C) is 7 percent. D) is 9 percent. E) cannot be determined because we do not know how many workers are retired. 58. Which of the following is correct A) The unemployment rates of men and women workers are roughly the same. B) Unemployment rates for black and white workers are approximately the same. C) Teenagers experience approximately the same unemployment rates as do adults. D) Laborers are less vulnerable to unemployment than are professional workers.")
45
59. Kim quit her job as an insurance agent to return to school full-time to earn an MBA degree. She is now done with school and is searching for a position in management. Kim is: A) cyclically unemployed. C) frictionally unemployed. B) structurally unemployed. D) not in the labor force. 60. The presence of “discouraged workers”: A) increases the size of the labor force, but does not affect the unemployment rate. B) reduces the size of the labor force, but does not affect the unemployment rate. C) may cause the official unemployment rate to understate the amount of unemployment. D) may cause the official unemployment rate to overstate the amount of unemployment.
 cyclically unemployed. C) frictionally unemployed. B) structurally unemployed. D) not in the labor force. 60. The presence of discouraged workers : A) increases the size of the labor force, but does not affect the unemployment rate. B) reduces the size of the labor force, but does not affect the unemployment rate. C) may cause the official unemployment rate to understate the amount of unemployment. D) may cause the official unemployment rate to overstate the amount of unemployment.")
46
Answers D C A B

47
Sample Calculations In an economy, Real GDP (base year = 1996) is $100 billion and the Nominal GDP is $150 billion. Calculate the GDP deflator. In an economy, Real GDP (base year = 1996) is $125 billion and the Nominal GDP is $150 billion. Calculate the GDP deflator. In an economy, Real GDP for year 2002 (base year = 1996) is $200 billion and the GDP deflator 2002 (base year = 1996) is Calculate the Nominal GDP for 2002. In an economy, Nominal GDP for year 2005 (base year = 1996) is $60 billion and the GDP deflator 2005 (base year = 1996) is 120. Calculate the Real GDP for 2005. GDP deflator=150 GDP deflator=120 Nominal GDP=$240 billion Real GDP=$50
 is $125 billion and the Nominal GDP is $150 billion. Calculate the GDP deflator. In an economy, Real GDP for year 2002 (base year = 1996) is $200 billion and the GDP deflator 2002 (base year = 1996) is 120. Calculate the Nominal GDP for In an economy, Nominal GDP for year 2005 (base year = 1996) is $60 billion and the GDP deflator 2005 (base year = 1996) is 120. Calculate the Real GDP for GDP deflator=150. GDP deflator=120. Nominal GDP=$240 billion. Real GDP=$50.")
48
CPI/ GDP Deflator (Year 1 as Base Year) Make year one the base year
Calculating CPI CPI/ GDP Deflator (Year 1 as Base Year) Nominal, GDP Inflation Rate Real, GDP Price Per Unit Units of Output Year 1 2 3 4 5 10 15 20 25 $ 4 5 6 8 4 Make year one the base year = Price of the same market basket in base year x 100 CPI Price of market basket in the particular year
 Nominal, GDP. Inflation Rate. Real, GDP. Price. Per Unit. Units of. Output. Year $ Make year one the base year. = Price of the same market. basket in base year. x 100. CPI. Price of market basket in the particular year.")
49
CPI/ GDP Deflator (Year 1 as Base Year)
Calculating CPI CPI/ GDP Deflator (Year 1 as Base Year) Nominal, GDP Inflation Rate Real, GDP Price Per Unit Units of Output Year 1 2 3 4 5 10 15 20 25 $ 4 5 6 8 4 $40 50 90 160 100 $40 40 60 80 100 100 125 150 200 N/A 25% 20% 33.33% -50% Inflation Rate % Change in Prices = Year 2 - Year 1 Year 1 X 100
 Nominal, GDP. Inflation Rate. Real, GDP. Price. Per Unit. Units of. Output. Year $ $ $ N/A. 25% 20% 33.33% -50% Inflation Rate. % Change. in Prices. = Year 2 - Year 1. Year 1. X 100.")
50
Make year three the base year
Practice Nominal, GDP Real, GDP Consumer Price Index (Year 3 as Base Year) Units of Output Price Per Unit Year 1 2 3 4 5 5 10 20 40 50 $ 6 8 10 12 14 $30 80 200 480 700 $50 100 200 400 500 60 80 100 120 140 Make year three the base year = Price of the same market basket in base year x 100 CPI Price of market basket in the particular year
 Units of. Output. Price. Per Unit. Year $ $ $ Make year three the base year. = Price of the same market. basket in base year. x 100. CPI. Price of market basket in the particular year.")
51
Problems with using CPI as a Measurement
Substitution Bias- As prices increase for the fixed market basket, consumers buy less of these products and more substitutes that may not be part of the market basket. (Result: CPI may be higher than what consumers are really paying) New Products- The CPI market basket may not include the newest consumer products. (Result: CPI measures prices but not the increase in choices) Product Quality- The CPI ignores both improvements and decline in product quality. (Result: CPI may suggest that prices stay the same though the economic well being has improved significantly)
 New Products- The CPI market basket may not include the newest consumer products. (Result: CPI measures prices but not the increase in choices) Product Quality- The CPI ignores both improvements and decline in product quality. (Result: CPI may suggest that prices stay the same though the economic well being has improved significantly)")
Similar presentations


 in Real GDP; alternating periods of expansions and recessions.>")

