Download presentation
Presentation is loading. Please wait.

0
Generator Cost Curves Generator costs are typically represented by up to four different curves input/output (I/O) curve fuel-cost curve heat-rate curve incremental cost curve For reference 1 Btu (British thermal unit) = 1054 J 1 MBtu = 1x10⁶ Btu 1 MBtu = MWh 3.41 Mbtu = 1 MWh
 = 1054 J. 1 MBtu = 1x10⁶ Btu. 1 MBtu = MWh Mbtu = 1 MWh.")
1
I/O Curve The IO curve plots fuel input (in MBtu/hr) versus net MW output.
 versus net MW output.")
2
Fuel-cost Curve The fuel-cost curve is the I/O curve scaled by fuel cost. Coal prices vary; around $1/Mbtu to $2/Mbtu

3
Heat-rate Curve Plots the average number of MBtu/hr of fuel input needed per MW of output. Heat-rate curve is the I/O curve scaled by MW Best for most efficient coal units is around 9.0

4
Incremental (Marginal) cost Curve
Plots the incremental $/MWh as a function of MW. Found by differentiating the cost curve

5
Mathematical Formulation of Costs
Generator cost curves are usually not smooth. However the curves can usually be adequately approximated using piece-wise smooth, functions. Two representations predominate quadratic or cubic functions piecewise linear functions In 476 we'll assume a quadratic presentation

6
Coal Four Types of Coal Anthracite (15,000 Btu/lb), Eastern Pennsylvania; used mostly for heating because of its high value and cost Bituminous (10,500 to 15,000 Btu/lb), most plentiful in US, used extensively in electric power industry; mined in Eastern US including Southern Illinois. Subbitunminous (8300 to 11,500 Btu/lb), most plentiful in Western US (Power River Basin in Wyoming); used in electric power industry Lignite or brown coal (4000 to 8300 Btu/lb), used in electric power industry Coals differ in impurities such as sulfur content
, most plentiful in US, used extensively in electric power industry; mined in Eastern US including Southern Illinois. Subbitunminous (8300 to 11,500 Btu/lb), most plentiful in Western US (Power River Basin in Wyoming); used in electric power industry. Lignite or brown coal (4000 to 8300 Btu/lb), used in electric power industry. Coals differ in impurities such as sulfur content.")
7
Coal Prices At $50 per ton and 11,800 Btu/lb, Illinois coal costs $2.12/Mbtu. Transportation by rail is around $0.03/ton/mile Source: US EIA

8
Coal Usage Example A 500 MW (net) generator is 35% efficient. It is being supplied with Western grade coal, which costs $1.70 per MBtu and has 9000 Btu per pound. What is the coal usage in lbs/hr? What is the cost?
 generator is 35% efficient. It is being supplied with Western grade coal, which costs $1.70 per MBtu and has 9000 Btu per pound. What is the coal usage in lbs/hr What is the cost")
9
Wasting Coal Example Assume a 100W lamp is left on by mistake for 8 hours, and that the electricity is supplied by the previous coal plant and that transmission/distribution losses are 20%. How much irreplaceable coal has he/she wasted?

10
Incremental Cost Example

11
Incremental Cost Example, cont'd

12
Economic Dispatch: Formulation
The goal of economic dispatch is to determine the generation dispatch that minimizes the instantaneous operating cost, subject to the constraint that total generation = total load + losses Initially we'll ignore generator limits and the losses

13
Unconstrained Minimization
This is a minimization problem with a single equality constraint For an unconstrained minimization a necessary (but not sufficient) condition for a minimum is the gradient of the function must be zero, The gradient generalizes the first derivative for multi-variable problems:
 condition for a minimum is the gradient of the function must be zero, The gradient generalizes the first derivative for multi-variable problems:")
14
Minimization with Equality Constraint
When the minimization is constrained with an equality constraint we can solve the problem using the method of Lagrange Multipliers Key idea is to modify a constrained minimization problem to be an unconstrained problem

15
Economic Dispatch Lagrangian

16
Economic Dispatch Example

17
Economic Dispatch Example, cont’d

18
Lambda-Iteration Solution Method
The direct solution only works well if the incremental cost curves are linear and no generators are at their limits A more general method is known as the lambda-iteration the method requires that there be a unique mapping between a value of lambda and each generator’s MW output the method then starts with values of lambda below and above the optimal value, and then iteratively brackets the optimal value

19
Lambda-Iteration Algorithm

20
Lambda-Iteration: Graphical View
In the graph shown below for each value of lambda there is a unique PGi for each generator. This relationship is the PGi() function.
 function.")
21
Lambda-Iteration Example

22
Lambda-Iteration Example, cont’d

23
Lambda-Iteration Example, cont’d

24
Lambda-Iteration Example, cont’d

25
Lambda-Iteration Solution Method
The direct solution only works well if the incremental cost curves are linear and no generators are at their limits A more general method is known as the lambda-iteration the method requires that there be a unique mapping between a value of lambda and each generator’s MW output the method then starts with values of lambda below and above the optimal value, and then iteratively brackets the optimal value

26
Generator MW Limits Generators have limits on the minimum and maximum amount of power they can produce Often times the minimum limit is not zero. This represents a limit on the generator’s operation with the desired fuel type Because of varying system economics usually many generators in a system are operated at their maximum MW limits.

27
Lambda-Iteration with Gen Limits

28
Lambda-Iteration Gen Limit Example

29
Lambda-Iteration Limit Example,cont’d

30
Back of Envelope Values
Often times incremental costs can be approximated by a constant value: $/MWhr = fuelcost * heatrate + variable O&M Typical heatrate for a coal plant is 10, modern combustion turbine is 10, combined cycle plant is 7 to 8, older combustion turbine 15. Fuel costs ($/MBtu) are quite variable, with current values around 1.5 for coal, 4 for natural gas, 0.5 for nuclear, probably 10 for fuel oil. Hydro, solar and wind costs tend to be quite low, but for this sources the fuel is free but limited
 are quite variable, with current values around 1.5 for coal, 4 for natural gas, 0.5 for nuclear, probably 10 for fuel oil. Hydro, solar and wind costs tend to be quite low, but for this sources the fuel is free but limited.")
31
Economic Load Dispatch including transmission Losses
The incremental production cost of a given plant over a limited range is given by:

32
The optimal load dispatch problem including transmission losses is defined as: Where PL is the total system loss which is assumed to be a function of generation. Introducing the Lagrangian multiplier , the auxiliary function is given by: The partial derivative of this expression when equated to zero, will give the condition for optimum load dispatch. i.e.

36
It is to note here that powers used on the R. H. S
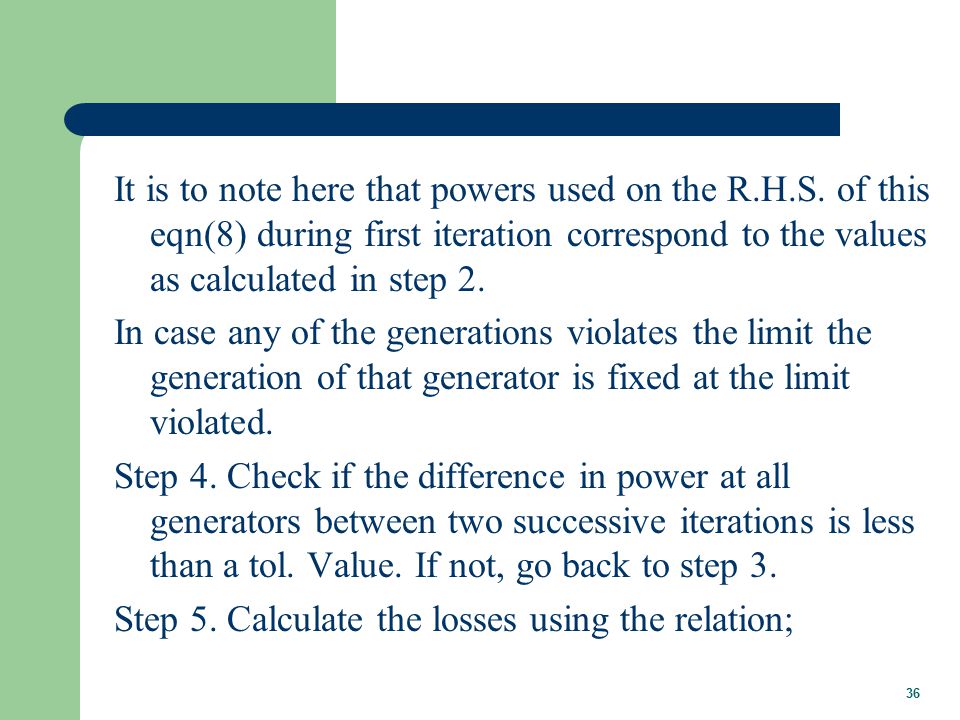
It is to note here that powers used on the R.H.S. of this eqn(8) during first iteration correspond to the values as calculated in step 2. In case any of the generations violates the limit the generation of that generator is fixed at the limit violated. Step 4. Check if the difference in power at all generators between two successive iterations is less than a tol. Value. If not, go back to step 3. Step 5. Calculate the losses using the relation;
 during first iteration correspond to the values as calculated in step 2. In case any of the generations violates the limit the generation of that generator is fixed at the limit violated. Step 4. Check if the difference in power at all generators between two successive iterations is less than a tol. Value. If not, go back to step 3. Step 5. Calculate the losses using the relation;")
38
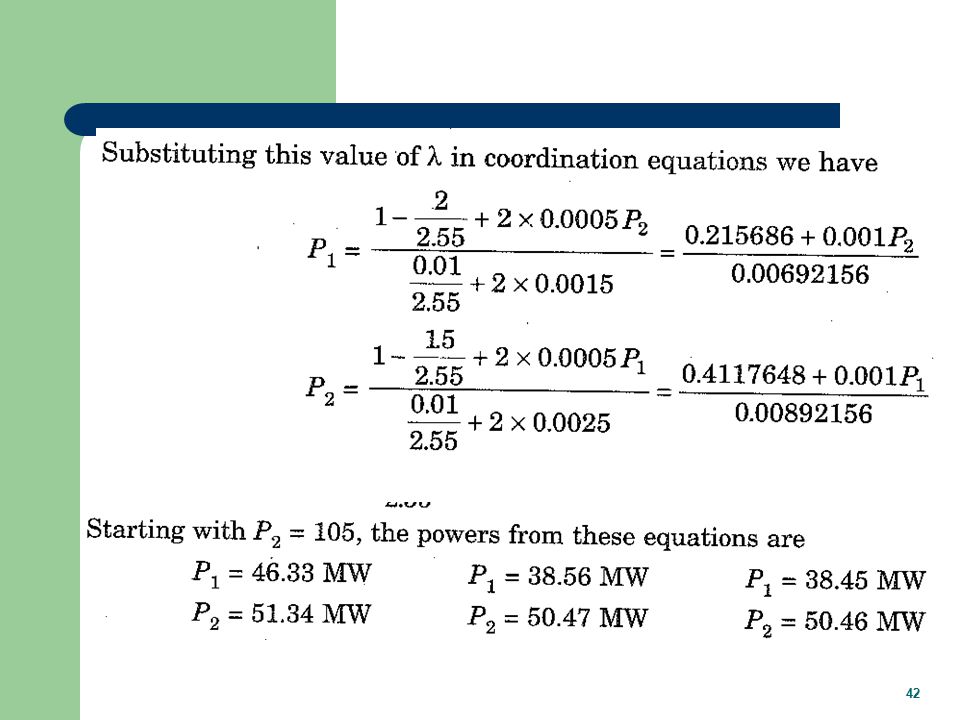
Prob. A sample power system has two generators with the incremental cost curves as; The loss coefficients in 1/MW units are ; B11 = , B12 = , B22= Considering lemda = 2.6, if the losses are coordinated, find the economic load schedule, losses and generation cost.

41
Generally load is given and the problem is to find economic load dispatch, losses and cost of the generation. For this we have to find out first the value of Lemda Let the load is 160 MW and the losses are coordinated rather than included.

47
Prob. The fuel input in Btu per hour of two generators operating in a plant are given by: The maximum and minimum loading limits on the generators are 100 MW and 10 MW respectively. Determine the minimum cost of the generation when the following loads are fed by the plant. The cost of fuel is SR 2.00 per million Btu.

50
Inclusion of Transmission Losses
The losses on the transmission system are a function of the generation dispatch. In general, using generators closer to the load results in lower losses This impact on losses should be included when doing the economic dispatch Losses can be included by slightly rewriting the Lagrangian:

51
Impact of Transmission Losses

52
Impact of Transmission Losses
The penalty factor at the slack bus is always unity!

53
Impact of Transmission Losses

54
Calculation of Penalty Factors

55
Two Bus Penalty Factor Example

56
Thirty Bus ED Example Because of the penalty factors the generator incremental costs are no longer identical.

57
Area Supply Curve The area supply curve shows the cost to produce the
next MW of electricity, assuming area is economically dispatched Supply curve for thirty bus system

58
Economic Dispatch - Summary
Economic dispatch determines the best way to minimize the current generator operating costs The lambda-iteration method is a good approach for solving the economic dispatch problem generator limits are easily handled penalty factors are used to consider the impact of losses Economic dispatch is not concerned with determining which units to turn on/off (this is the unit commitment problem) Economic dispatch ignores the transmission system limitations
 Economic dispatch ignores the transmission system limitations.")
Similar presentations


 calculation used to rank competing resources in the RPS.>")


. HW 5 is 2.38, 6.9, 6.18, 6.30, 6.34, 6.38; do by October 6 but does not need.>")


 maximum Slope = 0.>")


