Download presentation
Presentation is loading. Please wait.

1
Climate, Meteorology and Atmospheric Chemistry

3
Weather monitoring and forecasting Cloud type identification Climate studies Atmospheric contributions to climate Land-atmosphere interactions Ocean-atmosphere interactions Atmospheric chemistry Pollution monitoring Volcanic ash, other aerosols Active Remote Sensing (Radar) – many weather apps.
 – many weather apps.")
4
Von Karman Vortices

5
Hurricane Fran, 1996

6
MODIS Image Saharan dust moving across Mediterranean to Turkey

7
Sulfur Dioxide Plume – Kahlua

8
Earliest man-made satellites were designed for weather observations Vanguard 2 (1959) – designed to measure cloud cover but didn’t work well TIROS 1 (1960) – crude weather observations allowed scientists to view earth’s weather as a system Application Technology Satellites (1966) – full disk view of earth Nimbus satellites (1964 – 78) – atmospheric temperature and ozone profiles and other atmospheric properties Nimbus set the stage for modern satellite remote sensing
 – designed to measure cloud cover but didn’t work well TIROS 1 (1960) – crude weather observations allowed scientists to view earth’s weather as a system Application Technology Satellites (1966) – full disk view of earth Nimbus satellites (1964 – 78) – atmospheric temperature and ozone profiles and other atmospheric properties Nimbus set the stage for modern satellite remote sensing")
10
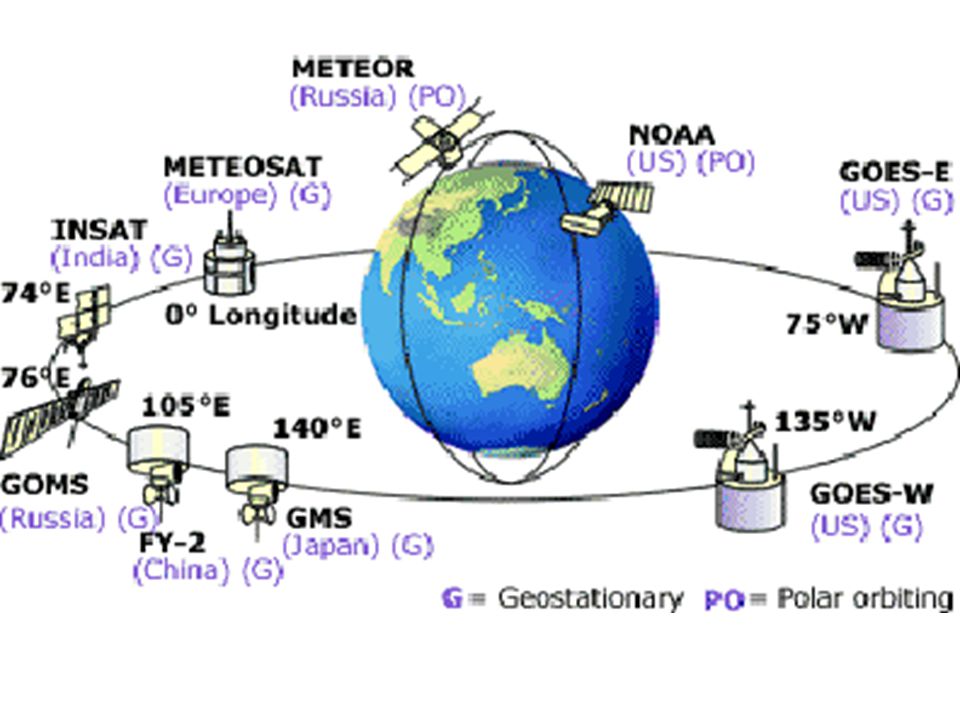
Defined by orbital characteristics Polar orbiting – travel roughly over poles on each orbit Typically two views/day of each place on earth Relatively high spatial resolution due to lower altitude than geostationary Geostationary – orbit parallel to the equator at an altitude of 22,300 miles; always over one place. Full hemisphere or large area viewing but usually at lower resolution due to altitude

11
GOES – Geostationary Operational Environmental Satellites GOES 12 also called GOES East – over Brazil but captures imagery for our entire hemisphere GOES 11 also called GOES West – over eastern Pacific Ocean NOAA operates several polar orbiting weather satellites (NPOES) Many other countries have their own weather satellites that are either polar orbiting and geostationary
 Many other countries have their own weather satellites that are either polar orbiting and geostationary")
13
GOES Composite Image of US Warm (low) clouds bluish, Cold (high) clouds yellow and red.
 clouds bluish, Cold (high) clouds yellow and red.")
14
GOES West Image Thermal IR Full Disk April 6, 2015

15
GOES East full disk Visible April 6, 2015

16
Interpretation of visible (panchromatic) images Cloud and aerosol thicknesses Interpretation of infrared images Cloud temperatures and heights Prognostication (prediction) Time-lapse views that show movement of systems Hurricane tracking and monitoring Data inputs for weather models
 images Cloud and aerosol thicknesses Interpretation of infrared images Cloud temperatures and heights Prognostication (prediction) Time-lapse views that show movement of systems Hurricane tracking and monitoring Data inputs for weather models")
17
Can see clouds (bright) and relative cloud thickness (brighter = thicker until saturation) Can see haze and aerosol (relatively bright) Cannot distinguish cloud heights (low, middle and high altitude clouds all look the same) Visible can only be used in the daytime
 and relative cloud thickness (brighter = thicker until saturation) Can see haze and aerosol (relatively bright) Cannot distinguish cloud heights (low, middle and high altitude clouds all look the same) Visible can only be used in the daytime")
18
Long-wave IR (thermal) allows sensing of the temperature of the cloud tops--related to height Higher cloud tops colder than low cloud tops IR Weather images are processed so that coldest places appear BRIGHT and warmest appear DARK Opposite of normal thermal imagery!! Can be used day or night.

19
Features Typically with a Relatively High Temperature Features Typically with a Relatively Low Temperature Snow/ice surfaces Land surfaces at low elevations Land surface at high elevations Land and ocean surfaces at low latitudes Land and ocean surfaces at high latitudes Land surfaces in early/mid afternoon Land surfaces near sunrise [Land surfaces in mid/late summer Land surfaces in mid/late winter]* [Ocean surfaces in late summer Ocean surfaces in late winter]**
![Features Typically with a Relatively High Temperature Features Typically with a Relatively Low Temperature Snow/ice surfaces Land surfaces at low elevations Land surface at high elevations Land and ocean surfaces at low latitudes Land and ocean surfaces at high latitudes Land surfaces in early/mid afternoon Land surfaces near sunrise [Land surfaces in mid/late summer Land surfaces in mid/late winter]* [Ocean surfaces in late summer Ocean surfaces in late winter]**](http://images.slideplayer.com/17/5266138/slides/slide_19.jpg "Features Typically with a Relatively High Temperature Features Typically with a Relatively Low Temperature Snow/ice surfaces Land surfaces at low elevations Land surface at high elevations Land and ocean surfaces at low latitudes Land and ocean surfaces at high latitudes Land surfaces in early/mid afternoon Land surfaces near sunrise [Land surfaces in mid/late summer Land surfaces in mid/late winter]* [Ocean surfaces in late summer Ocean surfaces in late winter]**")
20
IR Satellite imagery can also be used to create images of the amount of water vapor in the atmosphere

22
Several satellites have bands that are useful for atmospheric chemistry (e.g., MODIS) or are completely dedicated to the atmosphere (e.g., AURA) Aura flies “in formation” about 15 minutes behind MODIS Aura carries several instruments that measure different constituents of the atmosphere Other satellites TOMS – Total Ozone Mapping Spectrometer UARS – Upper Atmosphere Research Satellite
 or are completely dedicated to the atmosphere (e.g., AURA) Aura flies in formation about 15 minutes behind MODIS Aura carries several instruments that measure different constituents of the atmosphere Other satellites TOMS – Total Ozone Mapping Spectrometer UARS – Upper Atmosphere Research Satellite")
25
Note: Ground based sensors are used more than satellite sensors for atmospheric chemistry (and pollution) Can look outwards just as a satellite looks downwards and measure amount of light in various wavelengths Atmospheric absorption of particular wavelengths indicative of particular chemicals Strength of absorption relates to concentration of chemical Value of space based sensors is more in getting whole- atmosphere view; Ground based sensors limited spatially
 Can look outwards just as a satellite looks downwards and measure amount of light in various wavelengths Atmospheric absorption of particular wavelengths indicative of particular chemicals Strength of absorption relates to concentration of chemical Value of space based sensors is more in getting whole- atmosphere view; Ground based sensors limited spatially")
26
Satellites can measure and track plumes of air pollution E.g., MOPITT – Measurements Of Pollution In The Troposphere Measures amount of carbon monoxide and methane in the atmosphere Many satellites for atmospheric chemistry can also measure some pollutants

27
Photo by Mark Gocke, Casper Star Tribune.

28
Global carbon monoxide during MOPITT’s first year of operation CO produced by burning of fossil fuels, volcanoes, wildfire, etc.

29
Satellites are critical for weather forecasting and climate studies Optical data primarily used for cloud studies Thermal IR data also extremely useful (will discuss thermal later in semester) Atmospheric chemists use satellites for global and local monitoring Atmospheric pollution is a subset of atmospheric chemistry Satellites allow mapping of general pattern of pollutant concentration and tracking of plumes, etc.
 Atmospheric chemists use satellites for global and local monitoring Atmospheric pollution is a subset of atmospheric chemistry Satellites allow mapping of general pattern of pollutant concentration and tracking of plumes, etc.")
Similar presentations


 period ( 24 hours for each orbit) Always above same location. Must.>")


 Weather Satellite Interpretation 1. Visible satellite images are coded from black to white according to the amount of reflected.>")


 Solar Energy and the Atmosphere Standard 3 Objective 1 Indicators a, b, and c Standard 3 Objectives 1, 2, and 3 Workbook Pages 3,>")


 - Air borne LIDAR (pointing down) - Space borne LIDAR.>")


