Download presentation
Presentation is loading. Please wait.

1
Standards Unit SS6: Interpreting Distance Time Graphs
Suitable for students at Levels 6-7. Encompasses the calculation of acceleration. Standards Unit SS6: Interpreting Distance Time Graphs 1½ hours. Pair work for card sorting and use camera to record work.

2
No need to print

6
Consumable Resources Needed:
Need to add some extra blank cards to the card packs for the first round of card sorting because not all cards currently have a match. Re-usable Resources Needed: Each pair needs a pack of Cards A and B, and a separate pack of Cards C and D. Each pair needs a re-usable copy of Sheet 2, The Race. Still camera required to capture results of card sort. Mini-whiteboards needed for final plenary.

7
Notes to start. Students must be pre-assigned into pairs. Card Set A.

8
What does ‘accelerate’ mean?

9
Speed and Acceleration
Every morning Jane walks along a straight road to a bus stop 160m from her home, where she catches a bus to college. The graph shows her journey one particular day. Write a description of what may have happened, and include details of how fast she walked.

10
The graph shows a vintage car and motorbike travelling along a road.
Speed and Acceleration The graph shows a vintage car and motorbike travelling along a road. Again, describe what is happening. At what time were they both travelling at the same speed?

11
Speed and Acceleration of the Car
Car travels at a constant speed of 10 ms-1

12
Speed and Acceleration
Each second, the average speed of the bike increases by 5ms-1

13
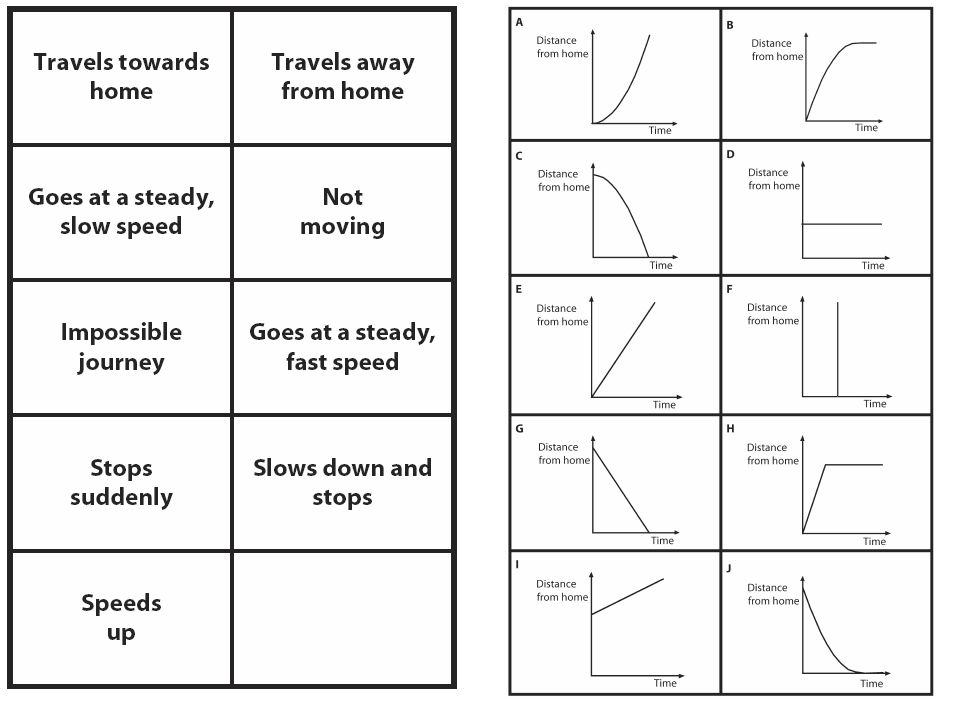
Pair Work: Card Sorting Activity
Try to match up the two different types of card. NOT ALL THE CARDS HAVE A MATCH – create your own additional cards to create matches for them all. Keep the cards neatly ordered because you will be adding to these later.

14
Solutions

15
Now Match More Cards Now match the next two sets of cards to the pairs you have already created. You may need to calculate the differences in speed in successive terms in the table in order to correctly match the graphs.

16
Solutions Collect up cards and replace in wallets.
Mini-whiteboards needed for next activity.

17
Assessment Show me a graph for: 1. A car travelling at a steady speed
Sketch some distance-time axes… Distance Time Show me a graph for: 1. A car travelling at a steady speed 2. A car speeding up 3. A car slowing down 4. A stationary car 5. Two cars travelling at the same speed towards one another 6. One car travelling slowly and another car overtaking it. 7. A child runs into the road so that a car needs to stop quickly 8. A car slows down to go over a speed bump and the speeds up

18
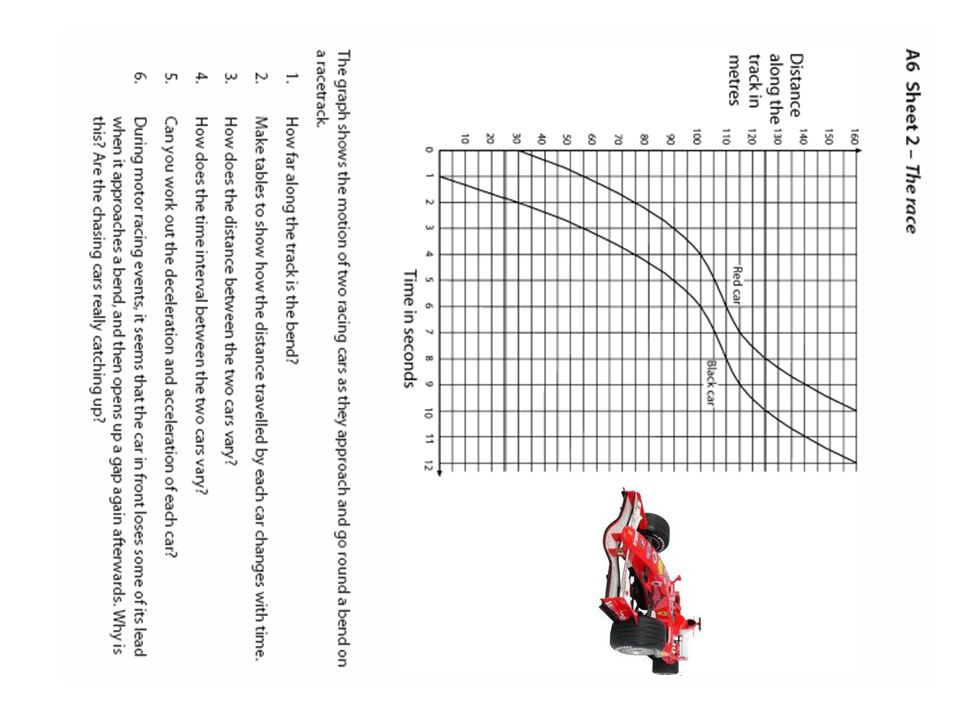
Now try the final worksheet…
Write answers in your books.

Similar presentations