Download presentation
Presentation is loading. Please wait.

1
R-Trees 2-dimensional indexing structure

2
R-trees 2-dimensional version of the B-tree: B-tree of maximum degree 8; degree between 3 and 8 Internal nodes with k children have k-1 split values

3
R-trees Can store: –a set of polygons (regions of a subdivision) –a set of polygonal lines (or boundaries) –a set of points –a mix of the above Stored objects may overlap
 –a set of polygonal lines (or boundaries) –a set of points –a mix of the above Stored objects may overlap")
4
R-trees Originally by Guttman, 1984 Dozens of variations and optimizations since Suitable for windowing, point location and intersection queries Heuristic structure, no order bounds ( O(..) ) Tree with higher degree: suitable for background storage (short search paths); one node per disk block
 ) Tree with higher degree: suitable for background storage (short search paths); one node per disk block")
5
Definition R-tree Every internal node contains entries (rectangle, pointer to child node) All leaves contain entries (rectangle, pointer to object) in database or file Rectangles are minimal bounding rectangles (MBR) The root has 2 and M entries All other nodes have at least m and at most M entries All leaves have the same depth m > 1 and M > 2m (e.g. m = 200; M = 1000)
.")
6
Object descriptions

7
Grouping of objects Windowing query: the fewer rectangles intersected, the fewer subtrees to descend into

8
Grouping of objects Objects close together in same leaves small rectangles queries descend in only few subtrees Group the child nodes under a parent node such that small rectangles arise

9
Heuristics for fast queries Small area of rectangles Small perimeter of rectangles Little overlap among rectangles Well-filled nodes (tree less deep fewer disk accesses on each search path)
")
10
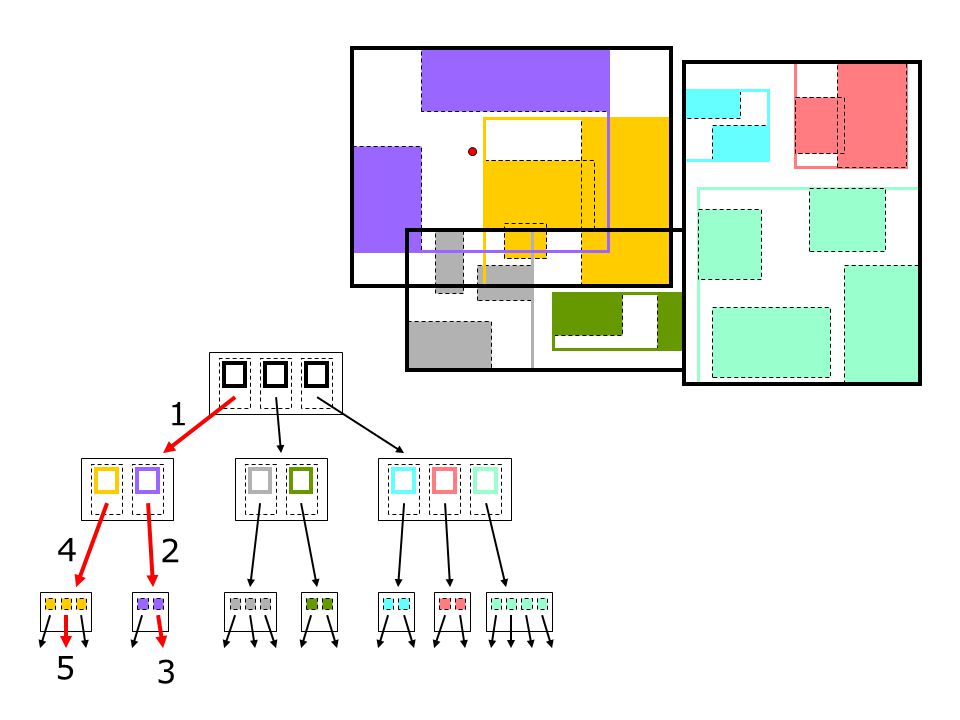
Example R-tree

15
Object descriptions

16
point containment query

18
Searching in an R-tree Q is query object (point, window, object); we search for intersections with stored objects For each rectangle R in the current node, if Q and R intersect, –search recursively in the subtree under the pointer at R (at an internal node) –get the object corresponding to R and test for intersection with R (at a leaf)
; we search for intersections with stored objects For each rectangle R in the current node, if Q and R intersect, –search recursively in the subtree under the pointer at R (at an internal node) –get the object corresponding to R and test for intersection with R (at a leaf)")
19
Nearest neighbor queries An R-tree can be used for nearest neighbor queries The idea is to perform a DFS, maintain the closest object so far and use the distance for pruning closest object so far queried pruned

20
1 2 3 4 5
21
Inserting in an R-tree Determine minimal bounding rectangle (MBR) of new object When not yet at a leaf (choose subtree): –determine rectangle whose area increment after insertion of R is smallest –increase this rectangle if necessary and insert R At a leaf: –if there is space, insert, otherwise Split Node
 of new object When not yet at a leaf (choose subtree): –determine rectangle whose area increment after insertion of R is smallest –increase this rectangle if necessary and insert R At a leaf: –if there is space, insert, otherwise Split Node")
27
Split Node Divide the M+1 rectangles into two groups, each with at least m and at most M rectangles Make a node for each group, with the rectangles and corresponding subtrees as entries Hang the two new nodes under the parent node in the place of the overfull node; determine the new MBRs (if the root was overfull, make a new root with two child nodes) If the parent has M+1 children, repeat Split Node with this parent
 If the parent has M+1 children, repeat Split Node with this parent")
28
Split Node, example New MBRs

29
Strategies for Split Node, I Determine R 1 and R 2 with largest MBR: the seeds for sets S 1 and S 2 While |S 1 |, |S 2 | < M - m and not all rectangles distributed: –Take not yet distributed rectangle R j, add to the set whose MBR increases least Linear R-tree of Guttman, 1984

30
Example Split Node I

31
Strategies for Split Node, II Determine R 1 and R 2 with largest area(MBR) - area(R 1 ) - area(R 2 ): the seeds for sets S 1 and S 2 While |S 1 |, |S 2 | < M - m and not all distributed: –Determine of every not yet distributed rectangle R j : d 1 = area increment of MBR(S 1 R j ) // w.r.t. MBR(S 1 ) d 2 = area increment of MBR(S 2 R j ) // w.r.t. MBR(S 2 ) –Choose R i with maximal | d 1 - d 2 | ; add it to the set with smallest area increment Quadratic R-tree of Guttman, 1984
 d 2 = area increment of MBR(S 2 R j ) // w.r.t. MBR(S 2 ) –Choose R i with maximal | d 1 - d 2 | ; add it to the set with smallest area increment Quadratic R-tree of Guttman,")
32
Example Split Node, II

33
Strategies for Split Node, III Determine R 1 and R 2 with largest area(MBR) - area(R 1 ) - area(R 2 ): the seeds for sets S 1 and S 2 // same as quadratic R-tree Determine axis with largest normalized separation of R 1 and R 2 ( x-separation / x-range of MBR(R 1 R 2 ), or y-separation / y-range of MBR(R 1 R 2 ) ) Sort rectangles according to that axis (lower left corner) and split evenly in subsets of size (M+1) / 2 Greene’s split, 1989
 - area(R 1 ) - area(R 2 ): the seeds for sets S 1 and S 2 // same as quadratic R-tree Determine axis with largest normalized separation of R 1 and R 2 ( x-separation / x-range of MBR(R 1 R 2 ), or y-separation / y-range of MBR(R 1 R 2 ) ) Sort rectangles according to that axis (lower left corner) and split evenly in subsets of size (M+1) / 2 Greene’s split, 1989")
34
Example Split Node, III Y-axis has largest normalized separation

35
Deletion from an R-tree Find the leaf (node) and delete object; determine new (possibly smaller) MBR If the node is too empty (< m entries): –delete the node recursively at its parent –insert all entries of the deleted node into the R-tree Note: Insertion of entries/subtrees always occurs at the level where it came from
 and delete object; determine new (possibly smaller) MBR If the node is too empty (< m entries): –delete the node recursively at its parent –insert all entries of the deleted node into the R-tree Note: Insertion of entries/subtrees always occurs at the level where it came from")
40
Insert as rectangle on middle level

41
Insert in a leaf object

53
R*-trees Experimentally determined measures for choices at insertion (Choose Subtree, Split Node) Experimentally determined algorithms for: –Choose Subtree –Split Node
 Experimentally determined algorithms for: –Choose Subtree –Split Node")
54
R*-trees; Choose Subtree At nodes directly above leaves: Choose entry (rectangle) with smallest overlap-increase At higher nodes: Choose entry (rectangle) with smallest area-increase (same as before) R,…, R are the entry rectangles 1 p
 with smallest overlap-increase At higher nodes: Choose entry (rectangle) with smallest area-increase (same as before) R,…, R are the entry rectangles 1 p")
55
R*-trees; Split Node Determine split axis: For both the x- and the y-axis: –sort the rectangles by smallest and largest coordinate –determine the M - 2m + 2 allowed distributions into two groups –determine for each: the perimeter of the two MBRs –add the M - 2m + 2 perimeter lengths Choose the axis with smallest sum of perimeters mm M - 2m + 1

56
R*-trees; Split Node Determine split index (given the split axis): Choose the distribution, among the M - 2m + 2, with the smallest area of intersection of the MBRs
: Choose the distribution, among the M - 2m + 2, with the smallest area of intersection of the MBRs")
57
Forced reinsert Build R-tree by repeated insertion: first inserted rectangles are possibly badly placed Experiment: –make R-tree by inserting 20.000 rectangles –again, but afterwards, delete the first inserted 10.000 and insert them again! Search time improvement of 20-50% !

58
Summary R-trees Versatile 2-dimensional search tree (referred to as: indexing structure, or spatial index) Some R-tree version used in most GIS Well-suited for windowing, point location, intersection, and nearest neighbor queries Heuristic structure, no order bounds ( O(..) ) Dynamic; insertions and deletions supported Tree with higher degree: well-suited for background storage (short search paths)
 Some R-tree version used in most GIS Well-suited for windowing, point location, intersection, and nearest neighbor queries Heuristic structure, no order bounds ( O(..) ) Dynamic; insertions and deletions supported Tree with higher degree: well-suited for background storage (short search paths)")
Similar presentations


 Masatoshi Yoshikawa.>")


 What is a B+ tree? Why B+ trees? Searching a B+ tree>")
. Can make sense because records may be much.>")
. Can make sense because records may be much.>")


 Z-ordering + B+-tree R-tree Variations: R*-tree, Hilbert.>")


1 LEARNING OBJECTIVES Problems with simple indexing. Multilevel indexing: B-Tree. –B-Tree creation: insertion and deletion of nodes.>")

