Download presentation
Presentation is loading. Please wait.

1
CHAPTER 10. WORKER MOBILITY: MIGRATION, IMMIGRATION, AND TURNOVER In 1996-97, –over 3 million workers moved between states –70 to 85 percent of movers cited economic reasons for the move. About one-half of all interstate moves are associated with a change in employment. Probability of an interstate move falls with age but rises with education. More educated people are more likely to make long distance moves.

2
Economic model of worker mobility PV of Net Benefits = where Bjt = $ from new job (j) in year t (mea Bot = $ from old job (0) in year t. T = number of years one expects to work at job j. C = the utility lost in the move itself (“moving costs”) r = discount rate
 r = discount rate.")
3
Predictions from model A worker is more likely to move if: –young more years to collect benefits “psychic” costs are lower peak years for mobility are ages 20-24 (12% move across state border each year) by age 47, mobility rate drops to 4 percent. –costs of move are low single versus family effect of second earner in family

4
Predictions from model Net “out-migration” from an area will occur if wages fall in that area relative to other areas. Short distance moves are more likely than long distance moves (C larger because of transportation costs and increasing cost of gathering information). –How will the growth of job information on the internet affect migration? If one country has a higher return to education than another, more educated workers will tend to move to the country with the higher return.
. –How will the growth of job information on the internet affect migration. If one country has a higher return to education than another, more educated workers will tend to move to the country with the higher return..")
5
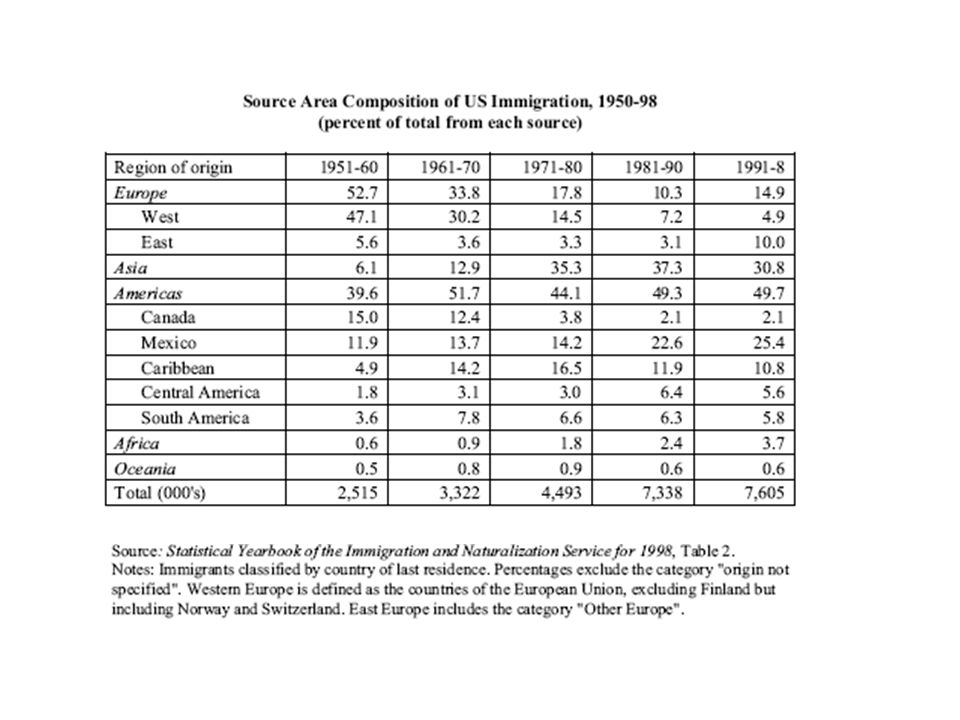
U.S. IMMIGRATION HISTORY Prior to 1920, U.S. had essentially unrestricted immigration. 1921, Quota Law passed. –set annual quotas based on nationality. –reduced immigration from eastern and southern Europe. 1965: Immigration and Nationality Act –abolished the quota system based on national origin. –1990 amendments allow: 675,000 people per year. 480,000 reserved for family reunification 140,000 reserved for immigrants with exceptional skills 55,000 reserved for “diversity” immigrants (immigrants from countries that have not recently provided many immigrants) political refugees are permitted without limit. Officially recorded immigration in 1996: 916,000 Illegal immigration estimated at 275,000 per year and 5 million in 1996.
 political refugees are permitted without limit. Officially recorded immigration in 1996: 916,000 Illegal immigration estimated at 275,000 per year and 5 million in")
6
LPR=legal permanent resident

8
Source:http://www.uscis.gov/graphics/shared/statistics/publications/USLegalPermEst_5.pdf

11
CONSEQUENCES OF IMMIGRATION Immigrants reduce wages, increase total employment, but reduce employment of natives.

12
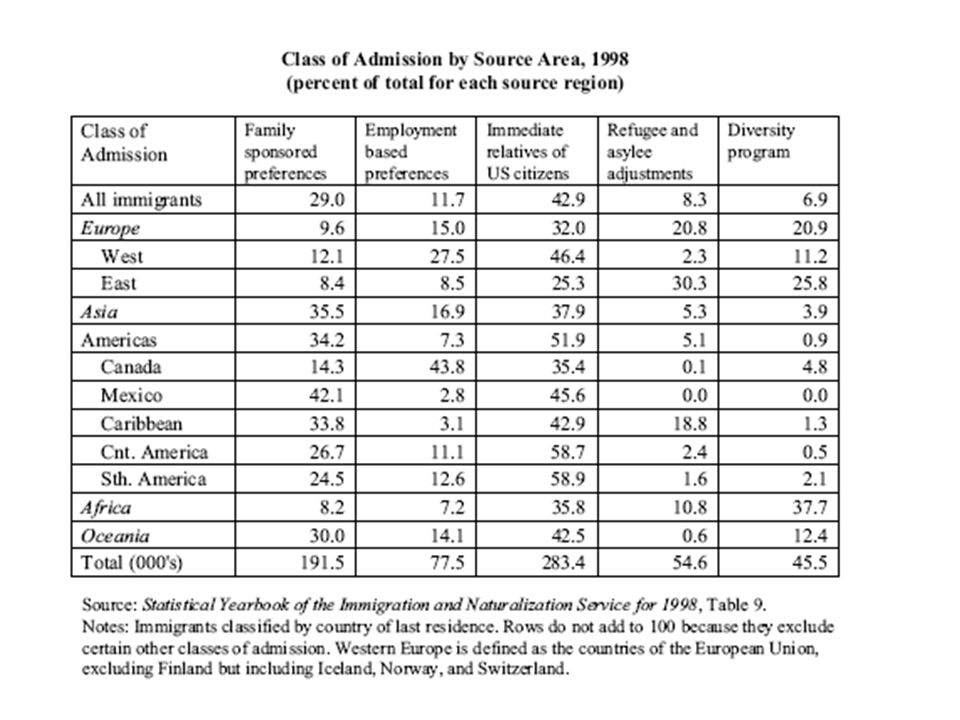
CONSEQUENCES OF IMMIGRATION Other considerations for labor market effects elasticity of labor supply elasticity of labor demand What if immigrants are gross complements to skilled labor? Evaluating immigration policy: labor market effects cost of goods and services. tax revenues versus government services evidence that those with above a high school education contribute more in taxes than they receive in government services; reverse for those with less than a high school education) should immigration policy be driven more by “skills”, family reunification, diversity?
 should immigration policy be driven more by skills , family reunification, diversity .")
13
CONSEQUENCES OF IMMIGRATION Empirical approach: W i = a0 + a1*%immigrant inflow i + a2*education i + … + e i Borjas (2003 NBER): -Argues city/state level analysis is flawed -Endogeneity of migration flows (biases a1 to zero) -Potential exits of natives (biases a1 to zero) Relevant labor market defined by education/experience groups. “immigration lowers the wage of competing workers: a 10 percent increase in supply reduces wages by 3 to 4 percent.” David Card (2005 NBER): “Overall, evidence that immigrants have harmed the opportunities of less educated natives is scant.” Relevant labor market defined by city in earlier studies Changed labor market to city/occupation in later study
: Overall, evidence that immigrants have harmed the opportunities of less educated natives is scant. Relevant labor market defined by city in earlier studies Changed labor market to city/occupation in later study.")
14
JOB MOBILITY Determinants of job mobility: compensation package –deferred pay –“efficiency” wages –Non-compete clauses what causes firms to offer a package that reduces quits? –specific training –large hiring/screening costs –high monitoring costs (more on this later) –Trade secrets men vs. women –men tend to receive more specific training and compensation packages that reduce turnover.
 –Trade secrets men vs. women –men tend to receive more specific training and compensation packages that reduce turnover..")
15
JOB MOBILITY large vs. small firms –large firms tend to invest more in training and have higher screening costs: monitoring problems. –much of the reason large firms have lower turnover is that their pensions are designed to penalize quitters. rural vs. urban areas. – easier to search in densely populated areas.

16
MOBILITY COSTS AND MONOPSONY For any given level of employment (Na + Nb), the firm will equate ME for each type of labor. The more inelastic is labor supply, the greater is the difference between ME and W. The more inelastic is labor supply, the lower the wage rate paid. LESS MOBILE WORKERS ARE PAID LESS.

17
MOBILITY COSTS AND MONOPSONY Applications of monopsony model –Married versus single –Urban versus rural –With vs. without children –Majority versus minority workers.

Similar presentations


, 1870–1920 Population is increasing, as is immigration. The labor force is also increasing.>")


>")