Download presentation
Presentation is loading. Please wait.

1
Hypothesis Testing

2
G/RG/R Null Hypothesis: The means of the populations from which the samples were drawn are the same. The samples come from the same population.

3
GG RR Alternative Hypothesis: The means of the populations from which the samples were drawn are different. The samples come from different populations.

4
Our problem: All we see are the data we have sampled, not the populations.

5
Are the sampled data most consistent with the null hypothesis “single population” idea? G/RG/R

6
GG RR Or with the alternative hypothesis “separate populations” idea,

7
Distribution of differences between the means of two samples drawn from the same population (m=0,s=1) -0.6-0.5-0.4-0.3-0.2-0.100.10.20.30.40.50.6 0 100 200 300 0 9 15 54 118 183 214 189 120 65 21 11 1 Difference Between the Means of the Samples Frequency (Probability *1000)
 Difference Between the Means of the Samples Frequency (Probability *1000)")
9
“What is the probability that the observed samples could have been drawn from the same population?” G/R P=0.79 xx

10
Distribution of differences between the means of two samples drawn from the same population (m=0,s=1) -0.6-0.5-0.4-0.3-0.2-0.100.10.20.30.40.50.6 0 100 200 300 0 9 15 54 118 183 214 189 120 65 21 11 1 Difference Between the Means of the Samples Frequency (Probability *1000)
 Difference Between the Means of the Samples Frequency (Probability *1000)")
11
“What is the probability that the observed samples could have been drawn from the same population?” G/R P=0.18 xx

12
Distribution of differences between the means of two samples drawn from the same population (m=0,s=1) -0.6-0.5-0.4-0.3-0.2-0.100.10.20.30.40.50.6 0 100 200 300 0 9 15 54 118 183 214 189 120 65 21 11 1 Difference Between the Means of the Samples Frequency (Probability *1000)
 Difference Between the Means of the Samples Frequency (Probability *1000)")
13
“What is the probability that the observed samples could have been drawn from the same population?” G/R P=0.02 xx

14
Distribution of differences between the means of two samples drawn from the same population (m=0,s=1) -0.6-0.5-0.4-0.3-0.2-0.100.10.20.30.40.50.6 0 100 200 300 0 9 15 54 118 183 214 189 120 65 21 11 1 Difference Between the Means of the Samples Frequency (Probability *1000)
 Difference Between the Means of the Samples Frequency (Probability *1000)")
15
The Dilemma How much risk to take when deciding whether the null or alternative hypothesis is correct? Too much risk and you may commit a Type I error – rejection of a true null hypothesis (accepting a false Alternative - deciding samples are different when they are the same). Too little risk and you may commit a Type II error – failure to reject a false null hypothesis (accepting a false null - deciding samples are the same when they are different). The accepted risk level is set at 0.05 or a 1 out of 20 chance that you will accidentally accept a false alternative – commit Type I error. Statistical tables are set to this level of risk.
. Too little risk and you may commit a Type II error – failure to reject a false null hypothesis (accepting a false null - deciding samples are the same when they are different). The accepted risk level is set at 0.05 or a 1 out of 20 chance that you will accidentally accept a false alternative – commit Type I error. Statistical tables are set to this level of risk..")
16
More on Type I and II Errors Sometimes in medical studies we seek to lower the chance of Type I errors (rejecting a true null hypothesis) and we may set the level for rejecting the null hypothesis lower – such as p = 0.01 or a 1 in 100 chance of committing Type I error Decreasing chance of Type I error will increase the chance of Type II error The only way to simultaneously reduce the risk of Type I and Type II errors is to increase sample size
 and we may set the level for rejecting the null hypothesis lower – such as p = 0.01 or a 1 in 100 chance of committing Type I error Decreasing chance of Type I error will increase the chance of Type II error The only way to simultaneously reduce the risk of Type I and Type II errors is to increase sample size")
17
Measurements of Central Tendency Data Set: 2 red, 3 blue, 1 green, 2 yellow, 2 black Frequency Histogram - Mean - sum of data divided by the number of data points Median - middlemost data point when data are arrayed in sequence (lowest to highest) Mode - most frequently occurring value red blue green yellow black 321321
 Mode - most frequently occurring value red blue green yellow black")
18
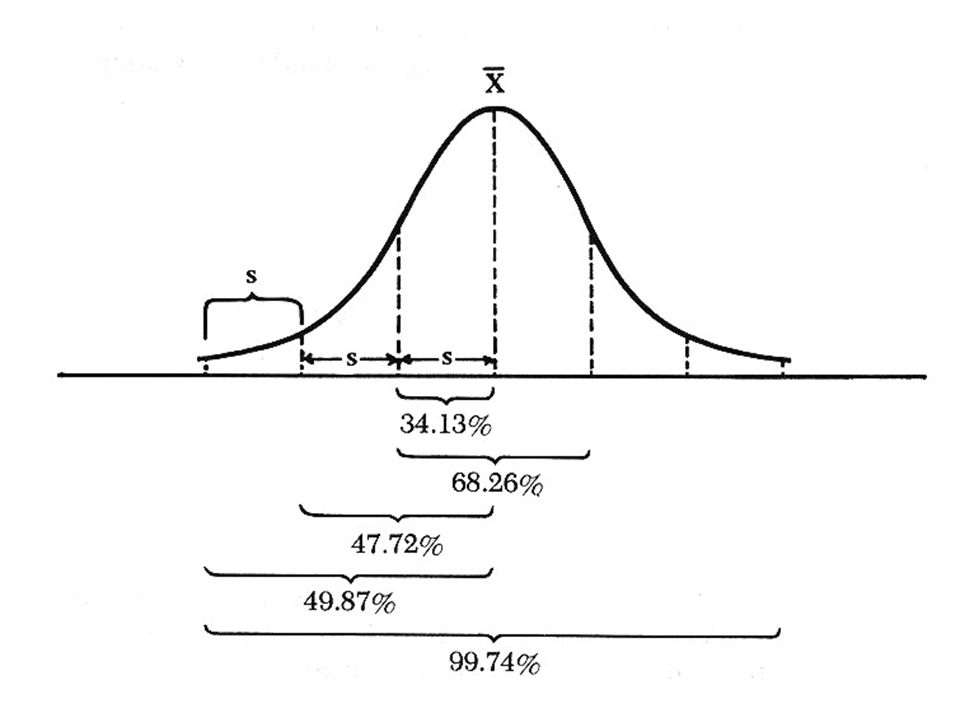
Measurements of Dispersion Data Set: Range: highest and lowest values Variance: s = Standard Deviation: the square root of variance Student A B C D E F G Exam I 90 95 85 90 85 90 95 Exam II 100 80 70 85 95 100 100 2 x – 2 x) 2 n n – 1
 2 n n – 1")
Similar presentations


 Used for continuous measures Statistical Analysis of Data ______________ statistics – summarize data.>")


 Form hypothesis Perform experiment and.>")


 Ryan Glaman Brett Kellerstedt 1.>")


