Download presentation
Presentation is loading. Please wait.

1
Glenn R. Mueller, Ph.D. Johns Hopkins University Real Estate Institute Director, Capital Markets & International Programs & Legg Mason, Inc. Real Estate Research Group Real Estate Investment Strategist grmueller@leggmason.com

2
Market Cycle Analysis Physical Cycle Demand, Supply and Vacancy affect Rental Growth

3
Legg Mason Real Estate Research Market Cycle Quadrants Declining Vacancy New Construction No New Construction Increasing Vacancy Declining Vacancy Increasing Vacancy More Completions New Construction Phase 1 - Recovery Phase 2 - Expansion Phase 3 - Hypersupply Phase 4 - Recession Demand/Supply Equilibrium Point Long Term Vacancy Average Occupancy Time

4
Physical Market Cycle Characteristics Negative Rental Growth Below Inflation Rental Growth Rents Rise Rapidly Toward New Construction Levels High Rent Growth in Tight Market Demand/Supply Equilibrium Rent Growth Positive But Declining - Below Inflation & Negative Rent Growth Cost Feasible New Construction Rents Long Term Average Occupancy Occupancy Time

5
2 5 4 3 8 9 7 10 16 15 13 1 6 11 14 1 12 0.3% 2.7% -3.0% -1.5% 1.7% 4.0% 6.4% 11.0% 12.5% 10.5% 6.7% -1.0% 1.6% 3.3% 6.1% 10.0% Historic National Office Rental Growth 30 Year Cycle - Periods 1968-1997 Long Term Average Occupancy Occupancy Time

6
2 5 4 3 8 9 7 10 16 15 13 1 6 11 14 1 12 -2.1% Historic National Industrial Rental Growth % 0.4% 0.8% 2.8% 3.0% 4.6% 5.1% 8.3% 8.5% 6.8% 3.8% -0.4% 0.7% 4.8% 4.6% 5.9% 30 Year Cycle - Periods 1968-1997 Long Term Avg Occupancy Occupancy Time

7
Retail 2nd –Tier Regional Malls National Property Type Cycle Locations 4th Qtr 2003 LT Average Occupancy Source: Mueller, 2004 Phase II - Expansion Phase I - Recovery Phase III- Hypersupply Phase IV - Recession Retail –1st-Tier Regional Malls Health Facility 11 14 6 7 8 9 10 12 13 1 16 5 4 3 2 1 Power Center Retail 15 Retail NH & Com Office - Downtown Office - Suburban Industrial-R&D Flex Industrial – Warehouse Multifamily Factory Outlet Retail Hotel - Full-Service Hotel - Ltd. Service Senior Housing+1

8
Orange County+1 Riverside+1 LT Average Occupancy Source: Mueller, 2004 11 14 6 7 8 9 10 12 13 1 15 16 5 4 3 2 1 Office Market Cycle Analysis 4th Quarter, 2003 Nashville-1 N. New Jersey New Orleans New York Norfolk Oklahoma City Orlando Philadelphia Phoenix Pittsburgh Portland Raleigh-Durham Sacramento Salt Lake San Antonio San Francisco San Jose Seattle Stamford St. Louis Tampa Wash DC W. Palm Beach NATION Ft. Lauderdale Honolulu Memphis Richmond San Diego+1 Wilmington Albuquerque Atlanta Austin Baltimore Boston Charlotte Chicago Cincinnati Cleveland Columbus Dallas FW Denver Detroit East Bay Hartford-1 Houston Indianapolis Jacksonville Kansas City Las Vegas Long Island Los Angeles Miami Milwaukee Minneapolis

9
Source: Mueller, 2004 11 14 6 7 8 9 10 12 13 1 15 16 5 4 3 2 1 4th Quarter, 2003 LT Average Occupancy Industrial Market Cycle Analysis Denver Ft. Lauderdale Honolulu Houston Jacksonville+1 New Orleans+1 Norfolk+1 N. New Jersey Richmond Sacramento San Antonio Wash DC San Diego Milwaukee Minneapolis Nashville New York Oklahoma City Orlando-1 Philadelphia Phoenix Pittsburgh Portland Raleigh-Durham Richmond Salt Lake San Francisco San Jose Seattle Stamford St. Louis Tampa NATION Atlanta Austin Baltimore Boston Charlotte Chicago Cincinnati Cleveland Columbus Dallas FW Detroit East Bay Hartford Indianapolis Kansas City Las Vegas Long Island Memphis Miami Los Angeles Orange County W. Palm Beach+1 Riverside+1

10
Source: Mueller, 2004 11 14 6 7 8 9 10 12 1 15 16 5 4 3 2 1 Boston Honolulu Sacramento W. Palm Beach Wash DC LT Average Occupancy Multifamily Market Cycle Analysis 4th Quarter, 2003 Norfolk Las Vegas+2 Los Angeles+1 Orange County+1 Orlando+2 San Diego Riverside Austin+1 Baltimore+1 Chicago+1 Cleveland Dallas FW+1 East Bay Ft. Lauderdale Milwaukee N. New Jersey Phoenix Pittsburgh Oklahoma City San Francisco Stamford 13 Atlanta Charlotte Cincinnati Columbus Denver Detroit Hartford Houston Indianapolis Kansas City Long Island Memphis Miami Minneapolis Nashville New Orleans New York Portland Raleigh-Durham Richmond St. Louis Salt Lake San Jose Seattle NATION Philadelphia+1 San Antonio+1 Tampa+1 Jacksonville

11
Source: Mueller, 2004 11 14 6 7 8 9 12 13 1 15 16 5 4 3 2 1 Retail Market Cycle Analysis 10 LT Average Occupancy 4th Quarter, 2003 East Bay Ft. Lauderdale Miami New York Phoenix Portland Sacramento Salt Lake San Diego San Francisco Seattle Tampa Baltimore Chicago Milwaukee Minneapolis Norfolk Orange County Pittsburgh Riverside San Antonio Stamford St. Louis NATION Austin Cincinnati Cleveland Columbus-1 Dallas FW Hartford Jacksonville Kansas City Las Vegas Oklahoma City Orlando Philadelphia Raleigh-Durham San Jose Atlanta Boston Charlotte Detroit Houston Indianapolis Los Angeles Memphis N. New Jersey Nashville Richmond+1 W. Palm Beach+1 Wash DC Denver+1 Honolulu+1 Long Island-1 New Orleans+1

12
Source: Mueller, 2004 14 6 7 8 9 12 13 1 15 16 5 4 3 2 1 11 10 LT Average Occupancy Hotel Market Cycle Analysis 4th Quarter, 2003 Norfolk Honolulu Jacksonville Las Vegas Nashville New York Oklahoma City+1 Orlando+1 Philadelphia Phoenix-1 Seattle Baltimore+1 Long Island Orange County+1 Sacramento Wash DC+1 W. Palm Beach+1 Los Angeles+1 Riverside San Diego Atlanta Austin Boston Cleveland Columbus-1 Dallas Detroit East Bay Hartford Indianapolis-1 Kansas City Minneapolis Pittsburgh-1 St. Louis San Jose Charlotte Chicago Cincinnati Denver Ft. Lauderdale Houston Memphis Miami Milwaukee New Orleans N. New Jersey Portland Raleigh-Durham Richmond Salt Lake San Antonio San Francisco Stamford Tampa NATION

13
1970s Cycle Factors Driving The First Half Cycle (5 Year) Strong Demand from the 1960s that stopped Recession 1974 Capital Flow Mortgage REITs produces oversupply Factors Driving The Second Half Cycle (5 Year) Baby Boom Generation Goes to Work Capital Flow Shut Down as Lenders Recover Markets tighten and reach peak occupancy 1979
 Strong Demand from the 1960s that stopped Recession 1974 Capital Flow Mortgage REITs produces oversupply Factors Driving The Second Half Cycle (5 Year) Baby Boom Generation Goes to Work Capital Flow Shut Down as Lenders Recover Markets tighten and reach peak occupancy 1979")
14
Source: FW Dodge, CB Commercial, BLS, Mueller Oversupply YearsBaby Boomers Go To Work

15
1980s Cycle Factors Driving The First Half Cycle (5 Year) Tight market in 1979 pushes rents and prices up Tax Act of 1981 attracts taxable investors supply up Factors Driving The Second Half Cycle (5 Year) Thrift Deregulation allows capital to flow Inflation pushes real estate prices higher Tax Act of 1986 slows taxable investors, but not tax free Poor stock market attracts Pension & Foreign capital Rising R.E. prices masks poor income returns

16
Source: FW Dodge, CB Commercial, BLS, Mueller Oversupply Years

17
1990s Cycle Factors Driving The First Half Cycle (5 Year) Moderate but stable demand growth (1991 recession minor) Oversupply and Foreclosures shut down construction Excess space absorbed - bringing markets back Factors Driving The Second Half Cycle (5 Year) Moderate Demand growth Continues Oversupply absorbed and return performance improves Construction “constrained” causing rents & prices to rise More efficient markets match supply to demand
 Moderate but stable demand growth (1991 recession minor) Oversupply and Foreclosures shut down construction Excess space absorbed - bringing markets back Factors Driving The Second Half Cycle (5 Year) Moderate Demand growth Continues Oversupply absorbed and return performance improves Construction constrained causing rents & prices to rise More efficient markets match supply to demand")
18
Source: FW Dodge, CB Commercial, BLS, Mueller Oversupply Absorbed Demand Supply Matched

19
2000s Cycle Demand Globalization - creates stable U.S. economy Job Growth out of Technology Change 2.4 million population growth per year for 10 years Baby boomers at “highest income earning” years second home market wave Echo boom children – college, first job, & renting Aging population not a major factor till 2014 Employment growth - determines demand - WHEN

20
Demand 2000s Cycle Baby Boom Echo Boom Gen X

21
2000s Cycle Baby Boom Echo Boom Gen X

22
Supply Constraint Public Markets make R.E. Capital markets efficient Economically driven capital - low spec construction Research watchdogs Constrained Supply (economically driven capital) construction labor harder to find materials costs increasing infrastructure problems constrain growth Feedback loop keeps demand and supply in better balance greater transparency Faster reaction to demand slowdown 2000s Cycle
 construction labor harder to find materials costs increasing infrastructure problems constrain growth Feedback loop keeps demand and supply in better balance greater transparency Faster reaction to demand slowdown 2000s Cycle.")
23
Retail 2nd -Tier Regional Malls National Property Type Cycle Forecast 4th Qtr 2004 ESTIMATE LT Average Occupancy Retail Neighborhood & Community Retail - 1st-Tier Regional Malls Source: Mueller, 2004 Phase II - Expansion Phase I - Recovery Phase III- Hypersupply Phase IV - Recession Health Facility 11 14 6 7 8 9 10 12 13 1 16 4 3 2 1 Hotel - Full-Service Hotel - Ltd. Service Industrial -Warehouse Multifamily Power Center Retail 15 5 Factory Outlet Retail Senior Housing Office – Downtown-1 Office – Suburban Industrial - R&D Flex

24
2000s Office Demand & Supply Source: FW Dodge, CB Commercial, BLS, PPR, Mueller Supply Reacted to Demand Slow Down FORECAST

26
Source: Mueller, 2004 11 14 6 7 8 9 10 12 13 1 15 16 4 3 2 1 4th Quarter, 2004 Estimates LT Average Occupancy Office Market Cycle FORECAST Albuquerque Ft. Lauderdale Honolulu Las Vegas Memphis Richmond San Diego+1 Wilmington 5 Baltimore-1 Boston New York Tampa-1 Orange County+1 Riverside+2 New Orleans Norfolk N. New Jersey Oklahoma City Orlando Philadelphia Phoenix Pittsburgh Portland Raleigh-Durham Sacramento Salt Lake San Antonio San Francisco San Jose Seattle Stamford St. Louis Wash, D.C. W. Palm Beach-1 NATION Atlanta Austin Charlotte Chicago Cincinnati Cleveland Columbus Dallas FW-1 Denver Detroit East Bay Hartford Houston Indianapolis Jacksonville Kansas City Long Island-1 Los Angeles Miami Milwaukee Minneapolis Nashville

27
LT Average 82.2%

28
Source: Mueller, 2004 11 14 6 7 8 9 10 12 13 1 15 16 5 3 1 4th Quarter, 2004 Estimates Denver Los Angeles Milwaukee Orange County San Diego W. Palm Beach LT Average Occupancy Industrial Market Cycle FORECAST Riverside 4 Atlanta Charlotte Chicago Cincinnati Cleveland Columbus Dallas FW Detroit Indianapolis Kansas City Las Vegas-1 Long Island Memphis Miami Minneapolis 2 Ft. Lauderdale Honolulu Jacksonville+1 New Orleans +1 Phoenix-1 Sacramento San Antonio Seattle NATION Nashville New York Oklahoma City Orlando Pittsburgh Portland Raleigh-Durham Richmond Salt Lake San Francisco San Jose Stamford St. Louis Tampa-1 East Bay-1 Houston-1 N. New Jersey-1 Norfolk Philadelphia Washington, D.C. Austin-1 Baltimore-1 Boston-1 Hartford-1

29
LT Average 92.3%

30
Source: Mueller, 2004 11 14 6 7 8 9 10 12 13 1 15 16 4 3 2 1 4th Quarter, 2004 Estimates Los Angeles Orange County+1 Sacramento San Antonio San Diego+1 LT Average Occupancy Multifamily Market Cycle FORECAST Charlotte Cincinnati Columbus+1 Detroit Long Island Memphis Pittsburgh San Jose Salt Lake Seattle Stamford Atlanta-1 Boston Honolulu Nashville Oklahoma City San Francisco Washington, D.C. Chicago Ft. Lauderdale Jacksonville Las Vegas+1 N. New Jersey Norfolk-1 Philadelphia+2 Riverside Tampa W. Palm Beach+1 Austin Baltimore Cleveland Dallas FW+1 East Bay Indianapolis+1 Kansas City-1 Milwaukee Minneapolis-1 New Orleans New York Phoenix St. Louis NATION Denver Hartford Houston-1 Miami-1 Portland Raleigh-Durham Richmond 5 Orlando+3

31
LT Average 92.3%

32
Source: Mueller, 2004 11 14 7 8 9 10 12 13 1 15 16 5 4 3 2 1 4th Quarter, 2004 Estimates Boston-1 Honolulu Houston-1 Indianapolis Long Island Los Angeles New Orleans Riverside San Antonio-2 Stamford St. Louis W. Palm Beach+1 LT Average Occupancy Retail Market Cycle FORECAST Austin Charlotte Cincinnati Cleveland Columbus-1 Dallas FW-1 Hartford Memphis N. New Jersey-1 Philadelphia San Jose-1 Atlanta Detroit Nashville+1 Oklahoma City Orlando+2 Richmond+2 East Bay Norfolk Phoenix San Francisco Salt Lake San Diego Tampa Jacksonville Kansas City Las Vegas Raleigh-Durham 6 Ft. Lauderdale+1 Miami+1 Washington DC Baltimore Chicago Denver+1 Milwaukee Minneapolis New York-1 Orange County Pittsburgh-1 Portland-1 Sacramento-1 Seattle NATION

33
LT Average 84.5%

34
Source: Mueller, 2004 11 14 6 7 8 9 10 12 13 1 15 16 5 4 3 2 1 4th Quarter, 2004 Estimates LT Average Occupancy Hotel Market Cycle FORECAST Austin Charlotte Cleveland Columbus Dallas FW+1 Denver Memphis Miami Minneapolis New Orleans N. New Jersey+1 Richmond Salt Lake San Francisco Tampa Chicago Cincinnati Ft. Lauderdale Las Vegas Milwaukee Nashville Orlando Portland Raleigh-Durham San Antonio Seattle Stamford NATION Honolulu Phoenix Sacramento Washington DC+1 Baltimore+1 Jacksonville Long Island New York Oklahoma City+2 Orange County+1 Philadelphia Atlanta Boston-1 Detroit East Bay Hartford Houston-1 Indianapolis-1 Kansas City Pittsburgh San Jose St. Louis Los Angeles Norfolk Riverside W. Palm Beach San Diego

35
LT Average 63.8%

36
Real Estate Financial Cycles Capital Flows Affect Prices

37
Hyper Supply LT Occupancy Avg. Market Cycle Capital Flow Impact Capital Flows to Existing Properties Capital Flows to New Construction Total Capital Flow Cycle Property Market Cycle Cost Feasible Rents Reached

38
National Office Physical Market Cycle vs Financial Cycle - New Permit Values Source: CB Commercial, Census Bureau Physical Financial Source: BEA, CB Commercial, Mueller

39
Flow of Funds Commercial Mortgages All Sectors (1976 - 2001) False Price Appreciation Support ? ($ Mils) Source: Federal Reserve Public Market Volatility
 Source: Federal Reserve Public Market Volatility.")
40
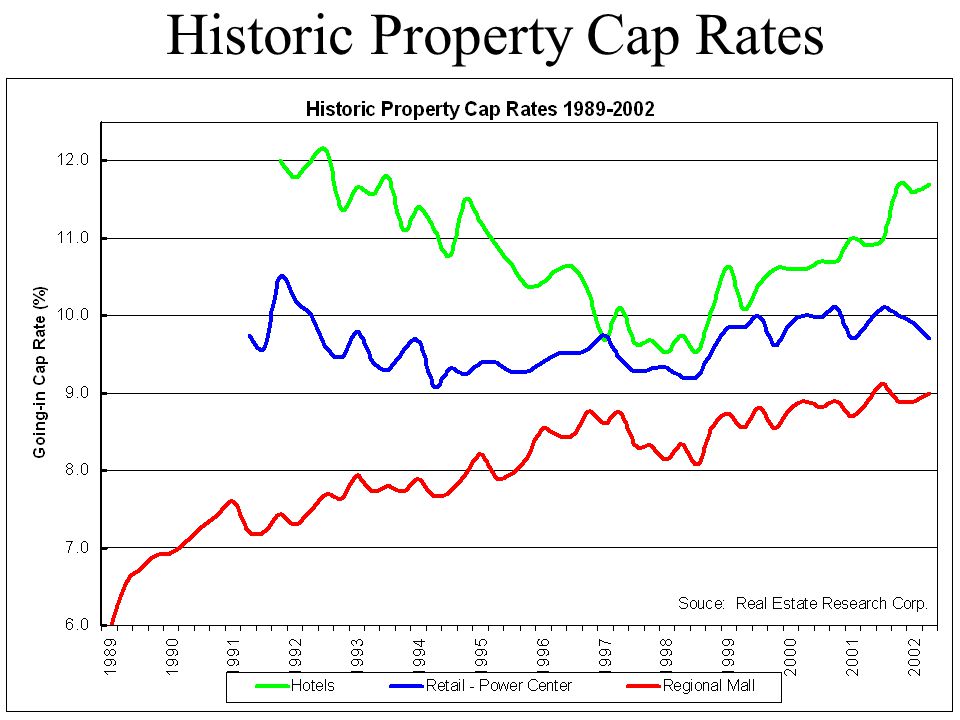
Historic Property Cap Rates

42
Transaction Pricing Source: Real Capital Analytics, New York www.rcanalytics.com 36/1636 deals 25/1319 deals 33/1624 deals 37/1798 deals

43
Where is U.S. Real Estate $ Capital Coming From 2000 20012002 2003 Source: Real Capital Analytics, New York www.rcanalytics.com

44
Reduce Bond Allocation to Minimum Level as Rates Rise

45
2003 Physical Cycle Demand & Supply Affect Vacancies Rental Growth Demand Growth - MUCH SLOWER for How long? Supply Slowing - how long to absorb? Return to Growth Phase in 2006? Wars stop progress - Create Economic Recovery after ? 2003 Financial Cycle Capital Flows Affect Prices – Stock Market Fear Real Estate the SAFEST Investment Alternative? Interest Rates are driving investments in the short run R E Equity – dominated by private markets (currently international) Public Market Debt – Biggest RE Capital Source Confidence will return in 200?
 Public Market Debt – Biggest RE Capital Source Confidence will return in")
46
For an electronic copy of the Legg Mason Real Estate Market Cycle Monitor Email grmueller@leggmason.com

Similar presentations


 WEEK 7: TELECOMMUNICATIONS AND THE CITY. READ: CHAPTER.>")


