Download presentation
Presentation is loading. Please wait.

1
Geography 360 Principles of Cartography May 22, 2006

2
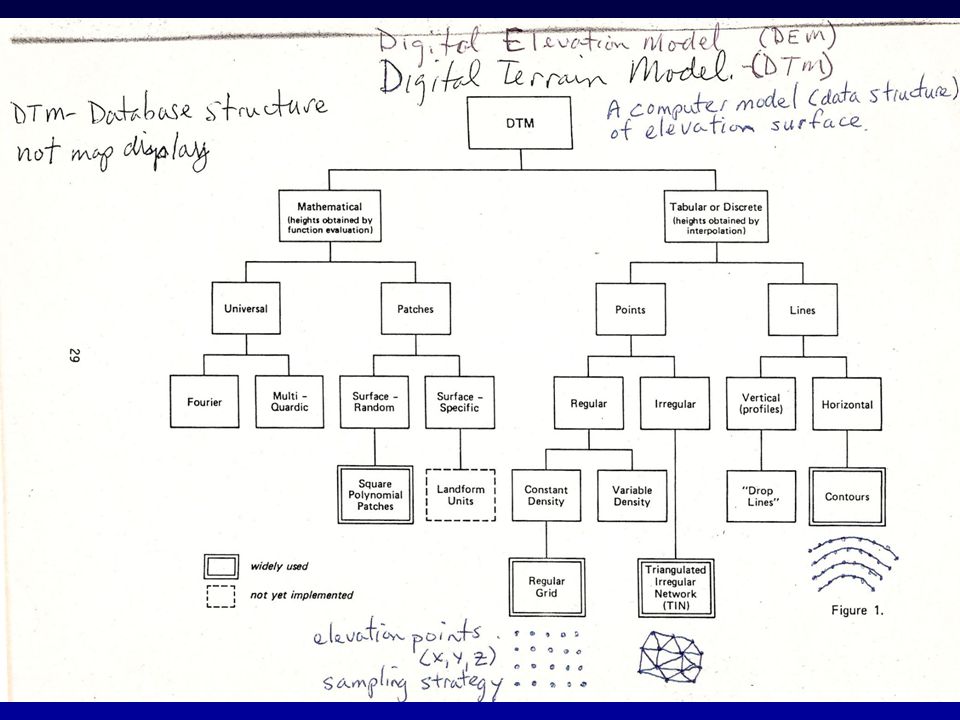
Outlines More on DEM –Typology of DEM –How is DEM generated? Critical enquiry strategies for final projects –Typology of geographic questions during map use, illustrated by water and community –Steps in geographic inquiry process Geospatial data search for final projects –Tips for data search –Metadata

4
How is DEM generated? From paper map (most common) –Vectorization of contour lines printed on the map (it can be seen as scattered points which has varying elevation values) –If necessary, hydrogrphy features (e.g. river) are added to enhance the quality of DEM –At grid points, elevation values are interpolated from measured points From remote sensed image –Photogrammetric techniques from aerial photo Extraction of elevation from photographs either manually (using stereoplotter) or automatically (using instruments) –Digital image processing from remote sensing e.g. LIDAR
 –Vectorization of contour lines printed on the map (it can be seen as scattered points which has varying elevation values) –If necessary, hydrogrphy features (e.g. river) are added to enhance the quality of DEM –At grid points, elevation values are interpolated from measured points From remote sensed image –Photogrammetric techniques from aerial photo Extraction of elevation from photographs either manually (using stereoplotter) or automatically (using instruments) –Digital image processing from remote sensing e.g. LIDAR.")
5
What is the difference among landscape, terrain, and elevation? Landscape: Look out the window across the world – everything you see Terrain: Look out the window across the world – natural earth surface Elevation: Look at the window across the world – height above mean sea level

6
What is the difference among typography, topology, and topography in regards to map representation? Typography: the study of typeface for creating text Topology: the study of adjacency, connectedness and containment in a spatial data objects Topography: the study of landscape surface

8
Geographical questions that support content-knowledge-building during map use Questions dealing with location and extent Questions dealing with distribution and pattern Questions dealing with spatial association Questions dealing with spatial interaction Questions dealing with spatial change

9
Geographical questions that support content-knowledge-building during map use Questions dealing with location and extent –Where is the phenomenon of interest? –How much of the phenomenon is there? –What is the phenomenon there? –Why is the phenomenon there?

10
Geographical questions that support content-knowledge-building during map use Questions dealing with distribution and pattern –Is there regularity in the phenomenon distribution? –Where is a phenomenon in relation to a similar one? –What kind of distribution does the phenomenon make? –Where are the limits of the phenomenon?

11
Geographical questions that support content-knowledge-building during map use Questions dealing with spatial association –What other phenomenon is there too? –Do phenomenon usually occur together in the same area?

12
Geographical questions that support content-knowledge-building during map use Questions dealing with spatial interaction –Is the phenomenon linked to other phenomenon? –What is the nature of the phenomena linkage?

13
Geographical questions that support content-knowledge-building during map use Questions dealing with spatial change –Has the phenomenon always been there? –How has the phenomenon changed spatially through time? –What factors have influenced the spread of phenomena?

14
Questions for critical enquiry about water and community Access and use of water –Where does our water come from? Where is stored? –Who uses this water (stakeholder – agriculture, business, households, other such as fish)?
 .")
15
Questions for critical enquiry about water and community Physical characteristics of watershed –What is the drainage area of the watershed where our drinking water comes from? If our drinking water comes from a watershed that is not where we live, how does this watershed compare to our local watershed? –How much forest cover is there in our watershed? What percent of our watershed is covered in impervious surfaces? –How has our watershed changed over time? What areas are not covered that were once open?

16
Questions for critical enquiry about water and community Environmental impacts related to people and fish –Is our water clean? Can we drink it? What are the sources of pollution (i.e. who and what is upstream)? –Are there salmon in our creeks? Are there barriers to fish passage way?
. –Are there salmon in our creeks. Are there barriers to fish passage way .")
17
Questions for critical enquiry about water and community Ownership of watershed property and water –Who owns the land in our watershed in regards to private, public and quasi-public (E.g. not-for-profit) ownership? –Who lives along the creeks? Who lives along the coast? Where do the richest and poorest people live? Why? –Who owns the water? Should water be considered a basic human right?
 ownership. –Who lives along the creeks. Who lives along the coast. Where do the richest and poorest people live. Why. –Who owns the water. Should water be considered a basic human right .")
18
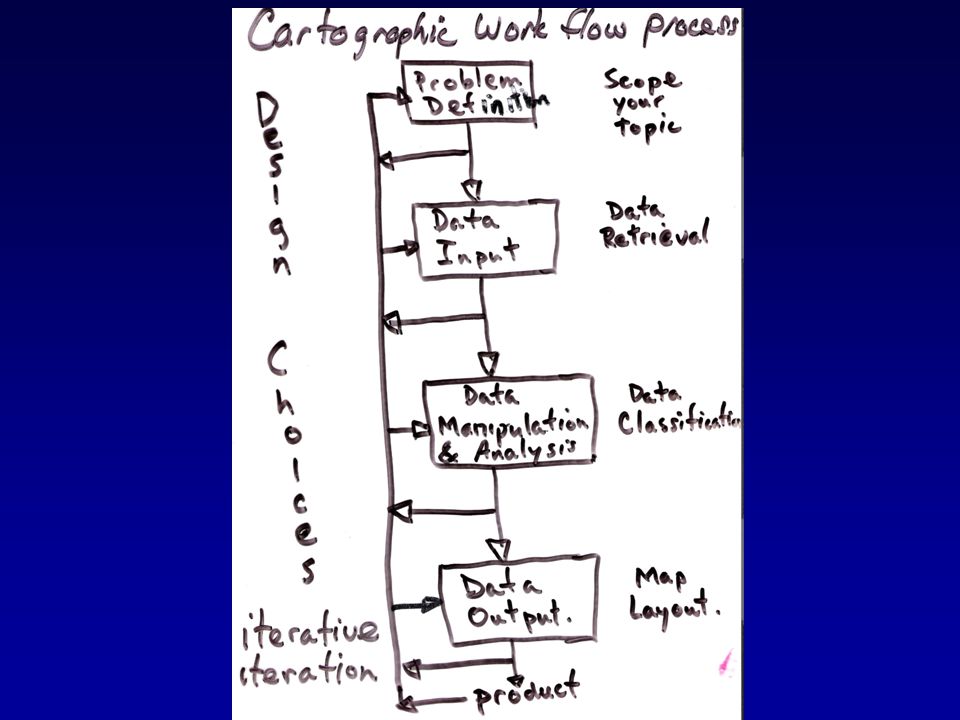
Stages and steps in a geographic enquiry process: using GIS maps for geographic investigations Stage (1) Research the questions and gather data –Step 1: identify and clarify questions, issues, problems –Step 2: gather and organize data Stage (2) Process the data –Step 3: interpret data –Step 4: analyze data –Step 5: evaluate evidence Stage (3) Reach and apply generalization –Step 6: generalize –Step 7: draw conclusions –Step 8: make value judgments (recommended policy) Stage (4) Re-evaluate decisions –Step 9: re-evaluate the investigation process Read Electronic: Slater for more details
 Research the questions and gather data –Step 1: identify and clarify questions, issues, problems –Step 2: gather and organize data Stage (2) Process the data –Step 3: interpret data –Step 4: analyze data –Step 5: evaluate evidence Stage (3) Reach and apply generalization –Step 6: generalize –Step 7: draw conclusions –Step 8: make value judgments (recommended policy) Stage (4) Re-evaluate decisions –Step 9: re-evaluate the investigation process Read Electronic: Slater for more details")
19
Acquiring spatial data Use data download service –USGS National Map Seamless Data Distribution System http://seamless.usgs.gov http://seamless.usgs.gov –USGS EROS Data Center http://edcwww.cr.usgs.gov/http://edcwww.cr.usgs.gov/ –Microsoft’s Terraserver http://terraserver.microsoft.com/http://terraserver.microsoft.com/ –TIGER/Line by Census Bureau or ESRI http://www.census.gov/geo/www/tiger/tiger2002/tgr2002.html http://www.esri.com/data/download/census2000_tigerline/index.html –Subnational GIS clearing house (e.g. WAGDA)… Use data catalogue service (or spatial portal) –Geospatial one-stop http://www.geodata.govhttp://www.geodata.gov –ESRI geographynetwork.com http://www.geographynetwork.com/http://www.geographynetwork.com/
… Use data catalogue service (or spatial portal) –Geospatial one-stop –ESRI geographynetwork.com")
20
Tips for data acquisition By geographic scale –Data resolution is often related to the geographic scale of data providing agency being considered –federal data sources have lower resolution with wider geographic coverage (e.g. LU/LC in EROS Data Center) –parcel data can be found in the local level (e.g. City of Seattle) By related agency and organizations –Best data about housing can be found in HUD… –Best data about transportation can be found in BTS… –Best data about education can be found in NCES… –Best data about justice can be found in BJS… By theme –Talk to resource persons in the area; they probably have go through data search processes
 –parcel data can be found in the local level (e.g. City of Seattle) By related agency and organizations –Best data about housing can be found in HUD… –Best data about transportation can be found in BTS… –Best data about education can be found in NCES… –Best data about justice can be found in BJS… By theme –Talk to resource persons in the area; they probably have go through data search processes.")
21
Download and read http://courses.washington.edu/geog360a/d ataatlibs2003.ppt for GIS data in UW and beyond http://courses.washington.edu/geog360a/d ataatlibs2003.ppt

22
Metadata Describes content and characteristics of data Helps determine fitness for use –Is the data suitable for the application? Is metadata always available? –No (much shared data is more likely to be published with metadata e.g. USGS public domain data) What if metadata is not available? –Look for data dictionary at least; or contact persons in charge Metadata standard for public data in the U.S. –FGDC metadata content standard (www.fgdc.gov)www.fgdc.gov Example: http://wa-node.gis.washington.edu/~uwlib/10mdem.htmlhttp://wa-node.gis.washington.edu/~uwlib/10mdem.html
 What if metadata is not available. –Look for data dictionary at least; or contact persons in charge Metadata standard for public data in the U.S. –FGDC metadata content standard ( Example:")
23
Determining fitness for use Does map scale or resolution of the data provide the level of details required by the application? –Using low-resolution satellite image for street-level survey is not acceptable –Any generalization algorithms used? Is data current enough to support needs identified from P1? –Using outdated data for replacing a old map is not acceptable Are specific characteristics of data useful for the application? –Topology for routing operation –Multispectral image for land use detection –Non-planar representation for 3D visualization Any processing steps linked to usefulness of data for specific applications? –Some processing steps brought about irreversible effects on data (e.g. unknown algorithm parameters)
.")
24
Determining fitness for use Is the stated level of accuracy sufficient given error tolerance? –Requirements for accuracy vary highly by the applications –Required types of accuracy vary by research questions (e.g. measuring parcel size require relative accuracy while surveying require absolute accuracy) Is the state level of completeness of features or attribute adequate to need-to-know question? –Some entities and attributes are required rather than optional Logical consistency of data? –Doesn’t data lack conformance to logical rules? (e.g. is identifier generated properly? Doesn’t data has too many sliver?) –Does metadata indicate that the agency put any effort in quality control? (e.g. lack of information in data quality section)
 Is the state level of completeness of features or attribute adequate to need-to-know question. –Some entities and attributes are required rather than optional Logical consistency of data. –Doesn’t data lack conformance to logical rules. (e.g. is identifier generated properly. Doesn’t data has too many sliver ) –Does metadata indicate that the agency put any effort in quality control. (e.g. lack of information in data quality section).")
Similar presentations