Download presentation
Presentation is loading. Please wait.

1
Managing Crop Margins Craig A. Chase Farm Management Field Specialist

2
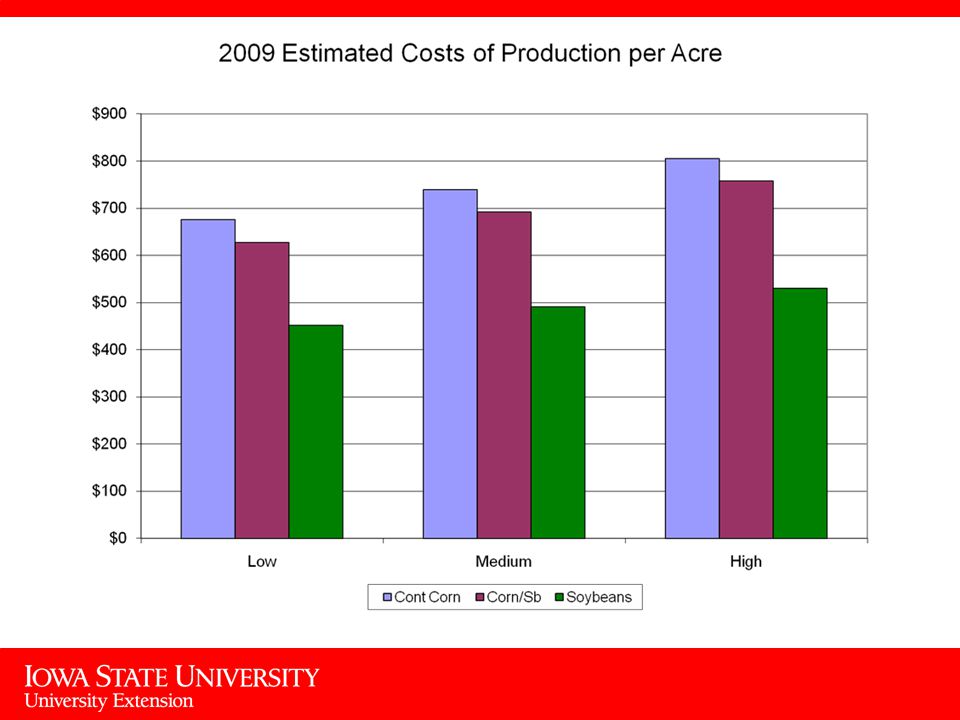
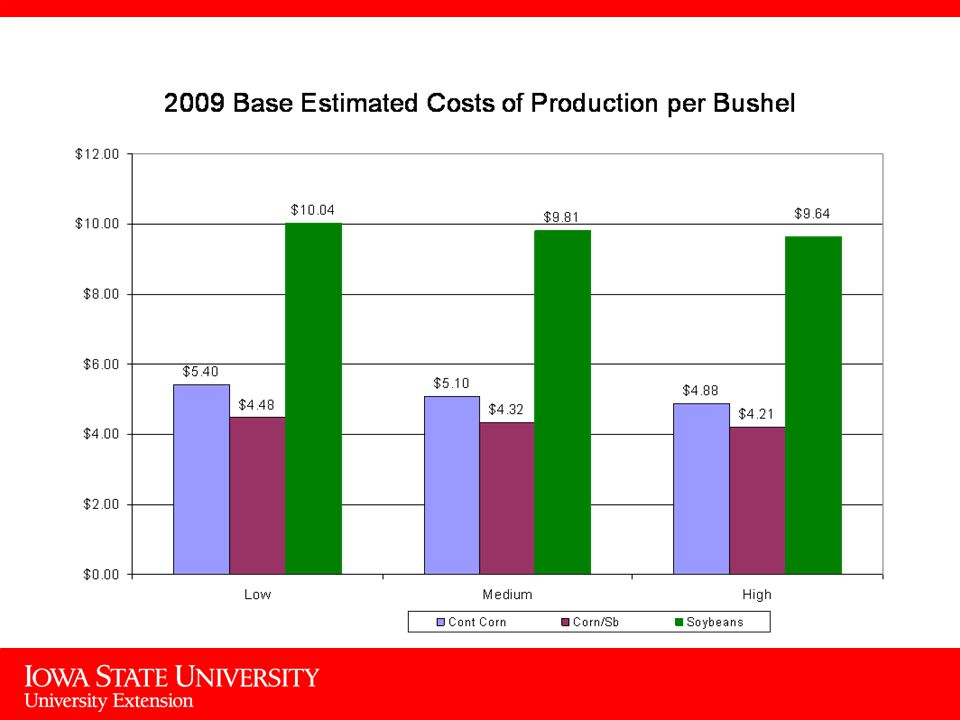
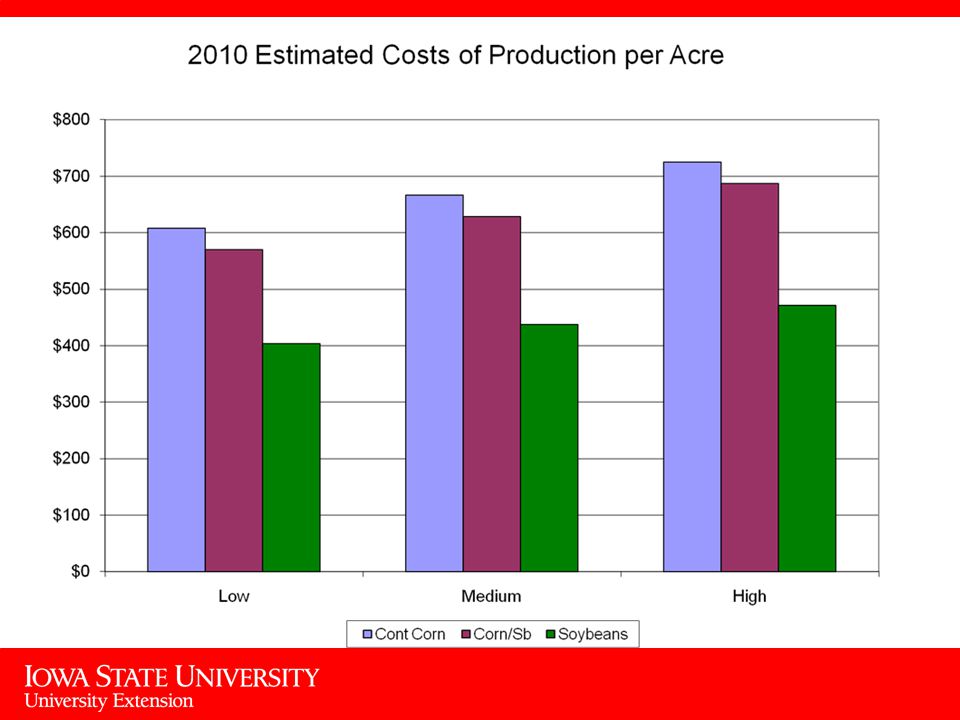
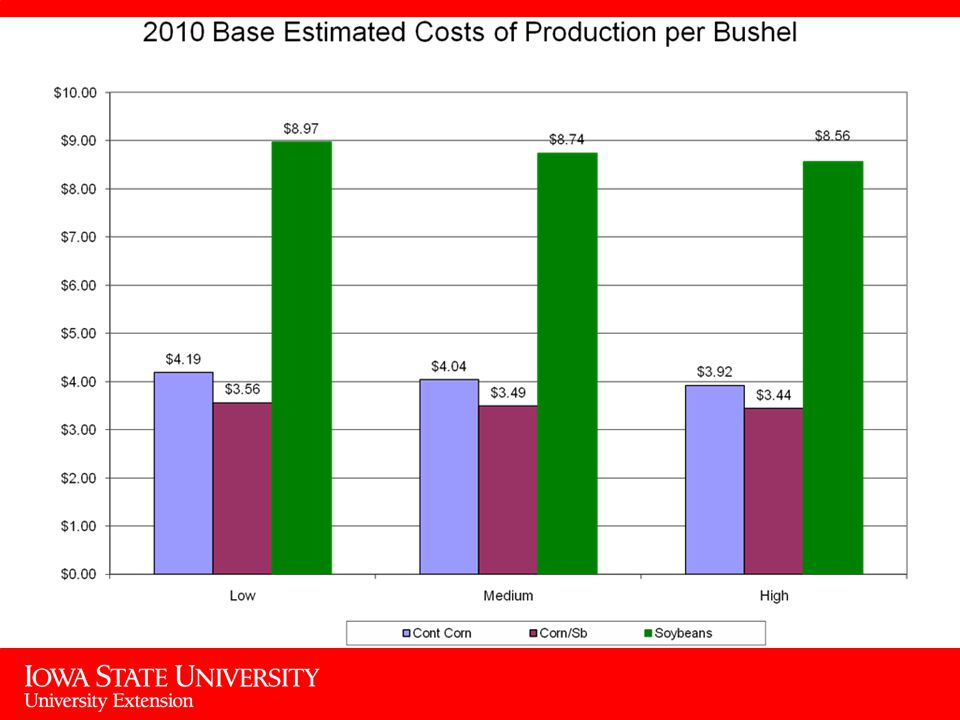
Presentation Objectives Review of 2009 – Costs and Marketing Preview of 2010 – Costs and Marketing Review of various decision tools

5
U.S. Corn Supply & Demand 200720082009 Area Planted(mil. acres)93.586.086.4 Yield(bu./acre)150.7153.9164.2 Production(mil. bu.)13,03812,10113,018 Beg. Stocks(mil. bu.)1,3041,6241,674 Imports(mil. bu.)201510 Total Supply(mil. bu.)14,36213,74014,702 Feed & Residual(mil. bu.)5,9135,2505,400 Ethanol(mil. bu.)3,0493,6504,200 Food, Seed, & Other(mil. bu.)1,3381,2761,280 Exports(mil. bu.)2,4371,8582,150 Total Use(mil. bu.)12,73712,06513,030 Ending Stocks(mil. bu.)1,6241,6741,672 Season-Average Price($/bu.)$4.20$4.06$3.35 Source: WASDE, Updated Oct. 9 th, 2009
 Yield(bu./acre) Production(mil. bu.)13,03812,10113,018 Beg. Stocks(mil. bu.)1,3041,6241,674 Imports(mil. bu.) Total Supply(mil. bu.)14,36213,74014,702 Feed & Residual(mil. bu.)5,9135,2505,400 Ethanol(mil. bu.)3,0493,6504,200 Food, Seed, & Other(mil. bu.)1,3381,2761,280 Exports(mil. bu.)2,4371,8582,150 Total Use(mil. bu.)12,73712,06513,030 Ending Stocks(mil. bu.)1,6241,6741,672 Season-Average Price($/bu.)$4.20$4.06$3.35 Source: WASDE, Updated Oct. 9 th,")
6
$3.75/bu 15% $3.25/bu 60% $3.10/bu 25% Corn Cash Price & Probability Forecast ’09-’10 Marketing Year Based on 86.4 M planted acres and 166 bu/A avg. yield Source: Wisner, ISU Biofuels Economist, Oct. 9 th, 2009

7
Corn Basis

8
U.S. Soybean Supply & Demand 200720082009 Area Planted(mil. acres)64.775.777.5 Yield(bu./acre)41.739.642.4 Production(mil. bu.)2,6772,9593250 Beg. Stocks(mil. bu.)574205138 Imports(mil. bu.)101510 Total Supply(mil. bu.)3,2613,1873,398 Crush(mil. bu.)1,8031,6621,690 Seed & Residual(mil. bu.)93106173 Exports(mil. bu.)1,1591,2801,305 Total Use(mil. bu.)3,0563,0493,169 Ending Stocks(mil. bu.)205138230 Season-Average Price($/bu.)$10.10$9.97$9.00 Source: WASDE, Updated Oct. 9 th, 2009
 Yield(bu./acre) Production(mil. bu.)2,6772, Beg. Stocks(mil. bu.) Imports(mil. bu.) Total Supply(mil. bu.)3,2613,1873,398 Crush(mil. bu.)1,8031,6621,690 Seed & Residual(mil. bu.) Exports(mil. bu.)1,1591,2801,305 Total Use(mil. bu.)3,0563,0493,169 Ending Stocks(mil. bu.) Season-Average Price($/bu.)$10.10$9.97$9.00 Source: WASDE, Updated Oct. 9 th,")
9
$10.50/bu 30% $8.95/bu 50% $8.50/bu 20% Soybean Cash Price & Probability Forecast ’09-’10 Marketing Year Based on 77.5 M planted acres and 43.3 bu/A avg. yield Source: Wisner, ISU Biofuels Economist, Oct.9 th, 2009

10
Soybean Basis

11
Storage Opportunities

12
Corn Storage Costs Assumption: Corn is Valued at $3.50/bu - Financed @ 7% APR.20.30.32.49.44.69.56.89

13
Sep $4.04 July $3.96 May $3.88 Mar $3.79 Corn Futures Carry Dec. 2009 $3.66 Source: www.cbot.com November 2009. Oct. 30th, 2009 Carry through July: is it large enough?

14
Soybean Storage Costs Assumption: Soybeans are Valued at $9.50/bu - Financed @ 7% APR.10.29.40.49.70.69 1.00

15
Sep $9.63 Jul $9.73 May $9.70 Mar. $9.75 Oct 30, 2009 Soybean Futures Carry Nov. 2009 $9.78 Source: www.cbot.com November 2009. No carry, difficult to justify storage

16
2010 Opportunities

19
$4.40/bu 18% $3.75/bu 65% $3.55/bu 17% Corn Cash Price & Probability Forecast ’10-’11 Marketing Year Based on 88 M planted acres and 159 bu/A avg. yield Source: Wisner, ISU Biofuels Economist, Oct. 9 th, 2009

20
December 2010 Corn Futures

21
$10.30/bu 18% $8.25/bu 65% $7.50/bu 17% Soybean Cash Price & Probability Forecast ’010-’11 Marketing Year Based on 76.2 M planted acres and 43.1 bu/A avg. yield Source: Wisner, ISU Biofuels Economist, Oct. 9 th, 2009

22
November 2010 Soybean Futures

23
Tools for Evaluation Machinery Economics http://www.farmdoc.uiuc.edu/pubs/FASTtool.asp?section=FAST http://www.extension.iastate.edu/agdm/wholefarm/xls/c2-21flexiblerentanalysis.xls http://www.extension.iastate.edu/agdm/crops/xls/a1-80rotationprofitabilitycalculator.xls Crop Rotation Calculator Flexible Rent Calculator Corn Nitrogen Rate Calculator http://extension.agron.iastate.edu/soilfertility/nrate.aspx

24
http://www.extension.iastate.edu/agdm/crops/xls/a1-80rotationprofitabilitycalculator.xls Crop Rotation Calculator With and without Nitrogen Optimizer

25
Decision #1 What should the crop rotation be? What are the choices? Are there alternative or specialty crops that are more profitable and that would fit into a rotation?

26
http://extension.agron.iastate.edu/soilfertility/nrate.aspx

27
Corn after SB $3.75 price $.40 N 123 pounds

28
Corn on Corn $3.75 price $.40 N 175 pounds

29
Decision #2 What should the fertility program look like? Can fertility costs be lowered without affecting yields? (over 1/3 of non-land production cost is from fertility).
..")
30
Machinery costs Fixed costsVariable costs Depreciation Interest Storage Insurance Repairs Labor Fuel

31
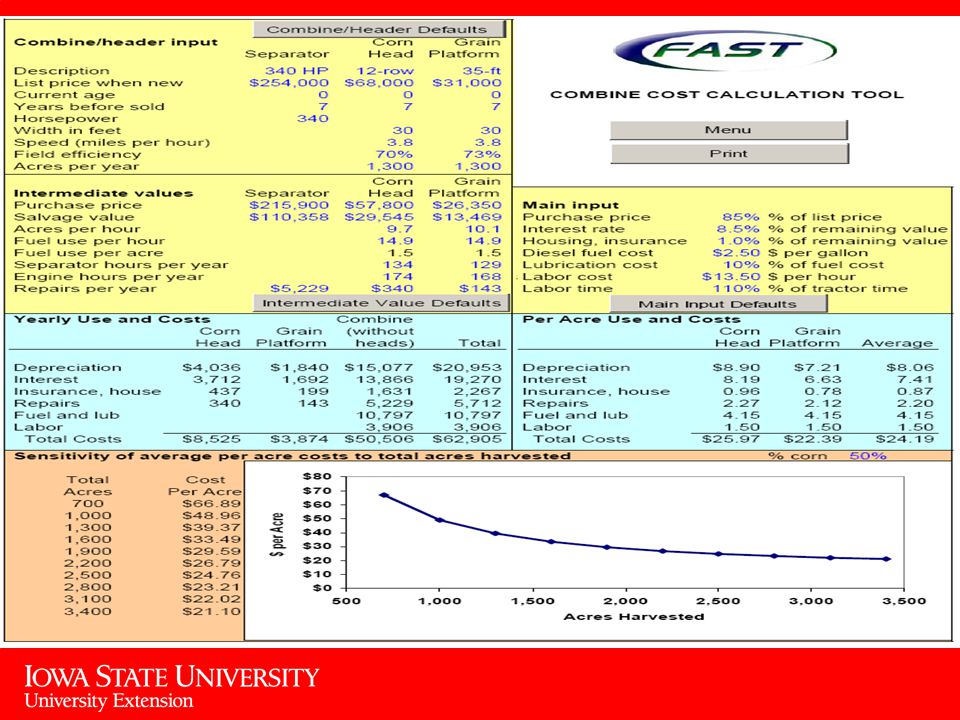
http://www.farmdoc.uiuc.edu/pubs/FASTtool.asp?section=FAST

33
Decision #3 Does the machinery “fit” the operation ? (not too big or too little) Do the custom rate charges reflect the costs of the machinery? Are there some machinery costs that can be re-evaluated (field operations)?
 Do the custom rate charges reflect the costs of the machinery. Are there some machinery costs that can be re-evaluated (field operations) .")
34
Tenants’ Residual http://www.extension.iastate.edu/agdm/wholefarm/xls/c2-20croplandcashrent.xls Computing a Cropland Cash Rental Rate

35
Flexible Cash Lease

37
Decision #4 Does the lease terms provide for some profitability? Can I re-negotiate the lease or move it toward a flexible terms lease?

38
Crop Insurance http://www.farmdoc.uiuc.e du/cropins/index.asp

39
Decision #5 Determine the right insurance product to meet your risk management needs. Make sure you have enough insurance, but are not “over-insured”. –Look at what the insurance product does compared to the farm marketing plan.

40
Risk Management Web Sites Ag Decision Maker – ISU Extension Economics www.extension.iastate.edu/agdm Farm Doc – U of IL Extension Economics www.farmdoc.uiuc.edu Center for Farm Financial Management – U of MN www.cffm.umn.edu

41
ISU Crop Marketing Web Sites Corn and Soybean Basis (State and County) www.card.iastate.edu/ag_risk_tools Ag Econ Periodicals, Publications and Programs www.econ.iastate.edu/outreach/agriculture/ Ag Decision Maker (Crop Updates/ Publications Decision Tools) http://www.extension.iastate.edu/agdm
 Ag Econ Periodicals, Publications and Programs Ag Decision Maker (Crop Updates/ Publications Decision Tools)")
42
Questions….. Any questions or comments? Thank You for This Opportunity! Craig A. Chase Farm Management Field Specialist 115 9 th Street NE Oelwein, IA 50662 (319) 238-2997 cchase@iastate.edu
")
Similar presentations